Translate this page into:
Unlocking the antiviral arsenal: Computational exploration of Langya virus (L, C, V, W) through phylogenetic analysis and molecular modeling

*Corresponding author: Venu Paritala, Department of Bioinformatics, Vignan’s Foundation for Science, Technology and Research (Deemed to be University), Guntur, Andhra Pradesh, India. vvenuparitala@gmail.com
-
Received: ,
Accepted: ,
How to cite this article: Paritala V, Kalva S, Shagamreddy R. Unlocking the antiviral arsenal: Computational exploration of Langya virus (L, C, V, W) through phylogenetic analysis and molecular modeling. Am J Biopharm Pharm Sci. 2024;4:7. doi: 10.25259/AJBPS_13_2024
Abstract
Objectives:
In response to the ongoing COVID-19 pandemic and the resurgence of the Langya virus (LayV) in Eastern China, there is an urgent need for novel antiviral treatments. Given the limited research available on LayV, this study aimed to explore its evolutionary relationships and construct accurate three-dimensional (3D) models of key viral proteins, which are essential for understanding the virus’s mechanisms and vulnerabilities.
Materials and Methods:
Computational approaches were employed to examine the evolutionary relationships of LayV using Molecular Evolutionary Genetics Analysis (MEGA). To build reliable 3D protein structures of the viral proteins C, L, W, and V, SwissModel and Faster AlphaFold (AF) were utilised. Model validation was conducted in PROCHECK, PROSA, Errat, Verify 3D, and Prove. Additionally, binding site analysis was carried out using various platforms such as Computed Atlas of Surface Topography of Proteins (CASTp), PHYRE2, PrankWeb, and SCFBio to ensure the robust identification of key interaction sites.
Results:
The phylogenetic analysis revealed that LayV is closely related to the Henipavirus genus. The structural models generated through SwissModel for the C, L, and W proteins showed high accuracy, with 93.2%, 89.4%, and 87.5% of residues residing in favoured regions, respectively. The AF model of the V protein exhibited optimal structural validation, with 82.0% of residues in favoured regions. Binding site analysis identified key interaction regions essential for targeted drug design.
Conclusion:
This comprehensive study highlighted the close evolutionary relationship between LayV and Henipaviruses and validated the structural models of key LayV proteins, offering a foundation for future antiviral drug design. The robust computational analysis and structural modelling provide a critical framework for selective drug development, contributing to the strategic fight against LayV.
Keywords
Langya virus
Phylogenetic evolution
Molecular modeling
Swiss model
AlphaFold
Molecular therapeutics
INTRODUCTION
The emergence of the Langya virus (LayV) poses a significant public health threat, particularly in Eastern China, with the potential for widespread transmission and pandemic outbreaks. Initially detected in individuals with animal exposure and fever, LayV has led to 100 confirmed cases between 2018 and 2023.[1] With no approved treatments available, it is imperative to unravel the virus’s mechanisms and develop effective countermeasures. Four crucial LayV proteins – L, C, V, and W – play pivotal roles in viral infection and dissemination. The L protein drives virus RNA synthesis, while the C protein regulates replication and assembly. In addition, the V protein aids in particle production and release, and the W protein facilitates immune evasion.[2,3] A thorough investigation into the origins of LayV indicates a likelihood of animal transmission, with shrews being identified as potential carriers. Yet, additional research is necessary to confirm this hypothesis. At present, there is no evidence of human-to-human transmission, underscoring the importance of cautious hygiene practices, especially following animal contact.[4]
LayV infections initially mimic flu-like symptoms, including fever, fatigue, coughing, and muscle pain, with rare instances of severe manifestations. LayV is related to other dangerous viruses such as Hernipavirus and Nipah, but it does not seem as deadly right now, yet continuous monitoring and research are important. Scientists are leveraging LayV proteins for diagnostics and therapeutics, developing targeted tests focusing on specific protein domains, and exploring antibody-based surveillance methods. Scientists are studying a new virus called LayV. They are looking closely at the proteins of this virus to develop ways to diagnose and treat infections.[5] For diagnosis, they are working on tests that can quickly and accurately detect LayV infection by focusing on specific parts of the virus proteins. They are also studying antibodies against these proteins to better understand how the virus spreads and affects people. In terms of treatment, they are looking at potential drugs that can target the activities of two important LayV proteins, L and W. However, figuring out the details of these proteins is tricky, so designing effective drugs is a complex task. Therapeutically, efforts are directed toward drugs targeting the L protein to inhibit virus replication and the W protein to mitigate immune interference. However, the intricacies of LayV protein interactions necessitate meticulous drug design to combat potential resistance. Understanding the pressing need for an antiviral against the LayV, this research initiative employs a strategic approach. Initially, it delves into the virus’s evolutionary history to grasp its origins and transmission patterns. Next, it utilizes advanced tools such as the Swiss Model (SM)[6] and AlphaFold (AF)[7] to examine a crucial virus protein in three dimensions. This detailed analysis of the protein’s structure is essential for understanding the viruses mechanisms and for informed therapeutic development.
MATERIALS AND METHODS
Evolutionary study of LayV: Findings from genetic analysis
In a thorough effort to decode the complex genetic narrative and evolutionary relationships of the Langya virus (LayV), we conducted a comprehensive analysis of its complete nucleotide sequence. The LayV sequence, with Accession No. OM101130.1 and GI No. 2284680832, was retrieved from the National Center for Biotechnology Information (NCBI) database. NCBI blast tool,[8] a program, was used to find the highly similar sequences in the LayV genome.
Our inaugural analysis, incorporating a diverse array of 45 genus sequences representing distinct species and subspecies, seamlessly aligns with recent breakthroughs.[5] These findings illuminate a close kinship between the LayV and its neighboring counterparts, specifically the Wenzhou shrew henipavirus and the Mojiang virus. A deep dive into the intricacies of the BLAST analysis[9] unveiled invaluable insights into the genetic architecture of the virus and its position within the broader evolutionary panorama.
By carefully interpreting the Karlin–Altschul statistics – lambda, K, and H – we gained a deeper understanding of the significance of the identified alignments. Lambda, a measure of the expected number of high-scoring alignments in a random database, whispered tales of evolutionary significance. K, reflecting the composition of the query sequence, and H, measuring its entropy, further illuminated the genetic landscape. While this initial analysis offers compelling insights, a comprehensive understanding of the LayV’s evolutionary narrative beckons further exploration. By meticulously considering the complete search settings and retrieved sequences, we anticipate unveiling a more profound comprehension of its origins, genetic diversity, and potential implications for future research and public health. The phylogenetic analysis utilizes the maximum likelihood (ML) method, complemented by sequence alignment through the MUSCLE algorithm[2,10-12] within the molecular evolutionary genetics analysis (MEGA) software framework. By incorporating these advanced computational techniques, our study reached a methodologically sound conclusion, providing nuanced insights into the evolutionary dynamics of the genetic elements under investigation.[13]
Assessing diverse evolutionary factors across various species
The sequences from various species were individually categorized to facilitate the assessment of diversity among species. The Kimura 2-parameter model[14] and a 1000-bootstrap variance estimation technique were employed to determine mean diversity within subpopulations, diversity within a species population, inter-population diversity, and the coefficient of divergence across species groups. For omicron, the analysis included codon locations comprising 1st+2nd+3rd+noncoding. The selective deletion option excluded instances with gaps and incomplete data from the dataset.[15]
Delving into nucleotide substitution: 24 models and model selection for ML analysis
This study originates from a rigorous analysis of nucleotide substitution models, drawing insights from applying ML fits. The data under examination comprises DNA sequences. The primary objective of this investigation is to unravel patterns of nucleotide changes over time, employing 24 distinct nucleotide substitution models. Nucleotide substitution models are statistical frameworks that elucidate the evolution of DNA sequences by describing the likelihood of different nucleotide changes. Utilizing the ML method allows for estimating model parameters that best align with the observed data, ensuring a robust and precise analysis. The study elucidates critical aspects of evolutionary dynamics to address the overarching of research hypothesis. The outcomes and implications of this analysis will be expounded upon in the subsequent results section.
Assessment of relative evolutionary rate and Tajima’s neutrality test
This investigation delves into estimating relative evolutionary rates and employs Tajima’s neutrality test as a critical analytical tool. The dataset utilized in this study comprises (specify the type of data, e.g., DNA sequences), obtained from (provide the source or origin of the data, e.g., genomic databases, experimental assays). The primary objective is to gauge the relative evolutionary rates among (specify the entities under study, e.g., species, populations) and to evaluate deviations from neutral evolution using Tajima’s test.[14] Relative evolutionary rates are assessed through a comprehensive analysis, leveraging (mention any specific methodologies, e.g., phylogenetic analyses, sequence alignments). Tajima’s neutrality test is also applied to discern patterns of genetic variation and potential deviations from the neutral evolution model. Applying these methodologies enables a nuanced understanding of the evolutionary dynamics and selection pressures shaping the genetic landscape of the studied entities.[16,17] The ensuing result section will expound upon the findings and implications of these analyses.
Homology modeling
Predicting proteins’ three-dimensional (3D) structure solely from their sequences remains a formidable task in computational biology. Addressing this, ColabFold emerges as a pioneering platform, leveraging the rapid homology search capabilities of MMseqs2 in conjunction with the cutting-edge AF2 technology. Notably, AF2 achieved exceptional success, showcasing its prowess by predicting 3D atomic coordinates for folded protein structures with a median global distance test total score of 93.4% during CASP14,[18] the international protein folding competition. This places AF2’s predictions in close alignment with experimental structure determination methods. Building on AF2’s innovations, RoseTTAFold independently reproduces and implements many successful strategies.
This study focuses on proteins T, L, C, V, and W, each possessing distinct characteristics. The protein sequences retrieved from NCBI provide essential details: W protein (446 aa) with Accession ID UUW06834.1 and GI number 2284917141, V protein (464 aa) with Accession ID UUW06833.1 and GI number 2284917140, C protein (177 aa) with Accession ID UUV47238.1 and GI number 2284680834, and L protein with Accession ID UUU45998. Our approach integrates SwissModel and AF2 within the ColabFold framework for protein structure prediction. Utilizing the SWISS-MODEL online server ensures comprehensive query sequence coverage and sequence identity, with the final 3D structures selected based on rigorous evaluation criteria, including global model quality estimation and Qualitative Model Energy Analysis (QMEAN) values. This dual-method approach enhances the accuracy and reliability of our protein structure predictions, marking a significant advancement in the field.
Assessment of a homology model
The validation process for the structural models obtained from AF and the SM involved a meticulous examination of the backbone conformation. This scrutiny was achieved by calculating the phi (φ) and psi (ψ) torsion angles and subjecting them to analysis through PROCHECK, which generates a Ramachandran plot. The results were cross-verified using the Structural Analysis and Verification Server (SAVES) to ensure robust validation. The ProQ web server, accessible at the Stockholm Bioinformatics Center website (http://www.sbc.su.se/~bjornw/ProQ/ProQ.html), was employed.[19] ProQ provides different score ranges, categorizing models based on LGscore (>1.5 as reasonably good, >2.5 as very good, and >4 as extremely good) and MaxSub (>0.1 as reasonably good, >0.5 as very good, and >0.8 as extremely good).
The ERRAT algorithm, tailored for evaluating crystallographic model building and refinement progress, was utilized for further assessment. ERRAT analyzes non-bonded interaction statistics between various atom types, offering valuable insights into model reliability. Verify 3D contributed to the analysis by visually assessing the crystal structure’s quality and scrutinizing the compatibility of the atomic model with the protein’s amino acid sequence.[20] Moreover, Prove played a role in calculating the volumes of atoms in macromolecules, enhancing the precision of the validation process. Finally, the PROSA test was applied to the ultimate model, scrutinizing energy criteria against the potential mean force derived from an extensive dataset of known protein structures. This comprehensive validation approach ensures the reliability and accuracy of the obtained structural models, meeting the highest assessment standards in protein structure prediction.
Active site prediction for modeled protein: Leveraging advanced computational tools
In the pursuit of elucidating crucial insights into the modeled protein, a strategic approach to active site prediction was employed, tapping into cutting-edge computational resources. The state-of-the-art Computed Atlas of Surface Topography of Proteins (CASTp) 3.0,[21] PHYRE2 Protein Fold Recognition and Analysis Server,[22] PrankWeb,[23] and SCFBio[24] played pivotal roles in this endeavor. CASTp, a dynamic online server, was harnessed to identify and quantify voids within the intricate 3D structure of the protein. Simultaneously, PHYRE2, a robust online web server recognized for its prowess in predicting and analyzing protein structure, function, and mutations, was utilized.
The protein’s 3D model was seamlessly uploaded to the CASTp and PHYRE2. We pinpointed the spatial locations of potential active sites and garnered insights into the essential amino acids orchestrating binding interactions.[25] This approach, merging computational efficiency with sophisticated algorithms, adds a layer of precision to our exploration of the protein’s functional domains, laying the groundwork for a nuanced understanding of its biological significance [Figure 1].
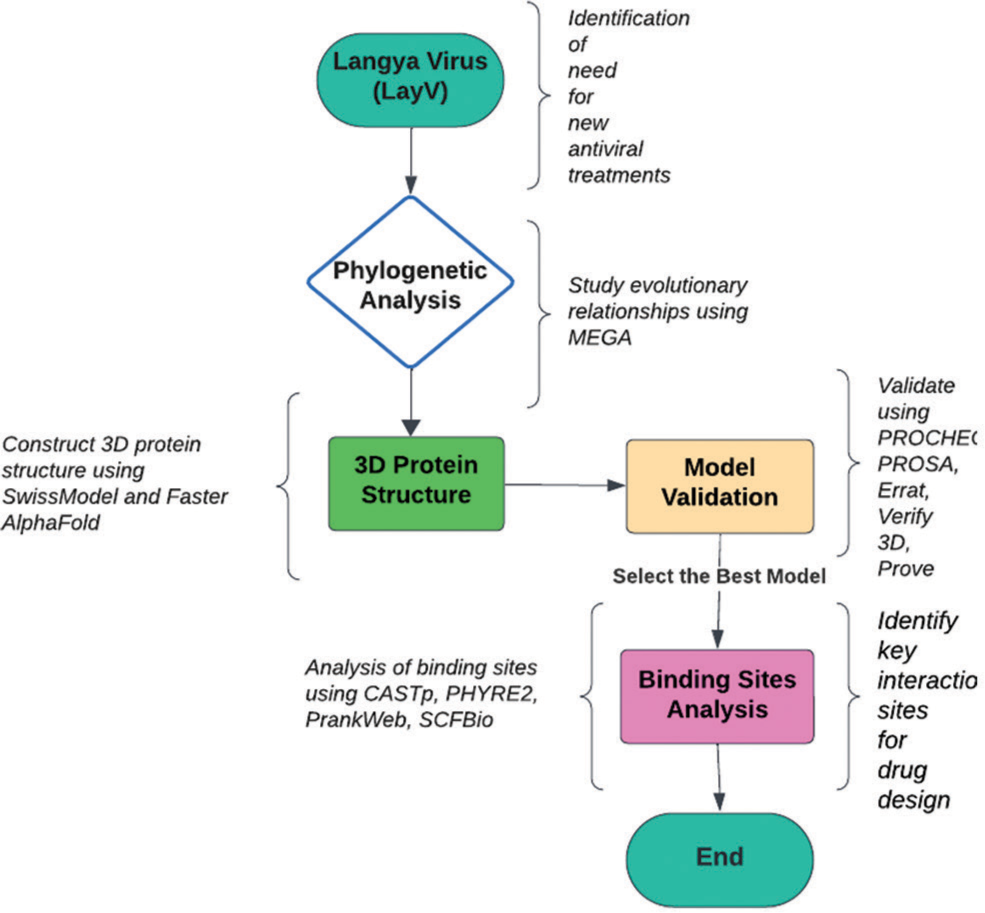
- Comprehensive workflow for protein analysis and modeling. MEGA: Molecular evolutionary genetics analysis, PROCHE: Protein contact heterogeneity, PROSA: Protein structure analysis, CASTp: Computed atlas of surface topography of proteins, PHYRE2: Protein homology/analogy recognition engine V 2.0, SCF: Stem cell factor.
RESULTS
The nucleotide sequences associated with the 16S rDNA region of the isolated forms have been meticulously archived in Table 1 of the NCBI database. Noteworthy is the analysis of LayV sp strains within the scope of this investigation, revealing a sequence homology spanning from 96% to 99% with LayV SDQD_S1801, as documented in the NCBI database. This assessment was conducted employing stringent criteria, including the consideration of the lowest E-value, maximum query coverage, and highest identity. Models characterized by the lowest Bayesian information criterion (BIC) scores were selected to best elucidate the substitution pattern. Within this framework, the K2 model, representing Kimura’s 2 parameters, demonstrated the most favorable BIC scores, registering at 228080.2 [Table 1A]. The consensus ML tree, depicted in Figure 2, was derived from the alignment of these sequences.
| Scientific name | Max score | Total score | Query cover (%) | E value | Per. ident | Acc. Len | Accession |
|---|---|---|---|---|---|---|---|
| LayV | 33983 | 33983 | 100 | 0 | 100 | 18402 | OM101130.1 |
| LayV | 33883 | 33883 | 100 | 0 | 99.9 | 18402 | OM101125.1 |
| LayV | 33839 | 33839 | 100 | 0 | 99.86 | 18402 | OM101129.1 |
| LayV | 33833 | 33833 | 100 | 0 | 99.85 | 18402 | OM101127.1 |
| LayV | 33828 | 33828 | 100 | 0 | 99.85 | 18402 | OM101128.1 |
| LayV | 33828 | 33828 | 100 | 0 | 99.85 | 18402 | OM101126.1 |
| Wenzhou shrew henipavirus 1 | 2523 | 3017 | 38 | 0 | 74.32 | 18426 | OQ715593.1 |
| Wenzhou Apodemus agrarius henipavirus 1 | 2067 | 2583 | 30 | 0 | 75.94 | 18309 | MZ328275.1 |
| Melian virus | 1441 | 1944 | 21 | 0 | 75.73 | 19944 | OK623353.1 |
| Mojiang virus | 1170 | 2012 | 17 | 0 | 78.87 | 18406 | NC_025352.1 |
| LayV | 939 | 939 | 2 | 0 | 99.8 | 511 | OM069586.1 |
| LayV | 939 | 939 | 2 | 0 | 99.8 | 511 | OM069585.1 |
| LayV | 939 | 939 | 2 | 0 | 99.8 | 511 | OM069584.1 |
| LayV | 939 | 939 | 2 | 0 | 99.8 | 511 | OM069576.1 |
| Jingmen Crocidura shantungensis henipavirus 1 | 472 | 472 | 7 | 2.00E-126 | 72.97 | 18535 | OM030314.1 |
| Wenzhou shrew henipavirus 1 | 425 | 425 | 5 | 2.00E-112 | 74.08 | 18425 | OQ715594.1 |
| Crocidura tanakae henipavirus | 320 | 320 | 4 | 8.00E-81 | 74.67 | 18480 | OQ970176.1 |
| Paramyxovirus PREDICT_PMV-13 | 134 | 134 | 1 | 1.00E-24 | 79.58 | 478 | MT063529.1 |
| Paramyxovirus PREDICT_PMV-13 | 134 | 134 | 1 | 1.00E-24 | 79.58 | 449 | MT063508.1 |
NCBI: National Center for Biotechnology Information, LayV: Langya virus
| Model | Param | BIC | AICc | lnL | Invariant | Gamma | R | Freq A | Freq T | Freq C | Freq G |
|---|---|---|---|---|---|---|---|---|---|---|---|
| GTR+G + I | 29 | 228080.3 | 227792.6 | −113867 | 0.114411 | 0.774539 | 1.850136 | 0.346618 | 0.284472 | 0.171901 | 0.19701 |
| GTR+G | 28 | 228087.2 | 227809.4 | −113877 | n/a | 0.522443 | 1.905099 | 0.346618 | 0.284472 | 0.171901 | 0.19701 |
| TN93+G + I | 26 | 228333.9 | 228076 | −114012 | 0.133251 | 0.838067 | 1.864269 | 0.346618 | 0.284472 | 0.171901 | 0.19701 |
| TN93+G | 25 | 228429.4 | 228181.3 | −114066 | n/a | 0.567377 | 1.632521 | 0.346618 | 0.284472 | 0.171901 | 0.19701 |
| HKY+G + I | 25 | 228485.4 | 228237.4 | −114094 | 0.127777 | 0.806532 | 1.878866 | 0.346618 | 0.284472 | 0.171901 | 0.19701 |
| HKY+G | 24 | 228611.5 | 228373.4 | −114163 | n/a | 0.583779 | 1.519447 | 0.346618 | 0.284472 | 0.171901 | 0.19701 |
| T92+G + I | 23 | 228631 | 228402.8 | −114178 | 0.125095 | 0.815219 | 1.853811 | 0.315545 | 0.315545 | 0.184455 | 0.184455 |
| T92+G | 22 | 228747.5 | 228529.3 | −114243 | n/a | 0.591848 | 1.516662 | 0.315545 | 0.315545 | 0.184455 | 0.184455 |
| GTR+I | 28 | 228794.9 | 228517.1 | −114231 | 0.286241 | n/a | 1.422571 | 0.346618 | 0.284472 | 0.171901 | 0.19701 |
| TN93+I | 25 | 229036.2 | 228788.2 | −114369 | 0.28425 | n/a | 1.316186 | 0.346618 | 0.284472 | 0.171901 | 0.19701 |
| HKY+I | 24 | 229175.2 | 228937 | −114445 | 0.285378 | n/a | 1.341011 | 0.346618 | 0.284472 | 0.171901 | 0.19701 |
| T92+I | 22 | 229346.6 | 229128.3 | −114542 | 0.283629 | n/a | 1.265774 | 0.315545 | 0.315545 | 0.184455 | 0.184455 |
| K2+G | 21 | 233252.9 | 233044.6 | −116501 | n/a | 0.630964 | 1.56209 | 0.25 | 0.25 | 0.25 | 0.25 |
| K2+G + I | 22 | 233316 | 233097.7 | −116527 | 0.07975 | 0.733594 | 1.847561 | 0.25 | 0.25 | 0.25 | 0.25 |
| K2+I | 21 | 233675.6 | 233467.2 | −116713 | 0.284355 | n/a | 1.359203 | 0.25 | 0.25 | 0.25 | 0.25 |
| GTR | 27 | 233903.6 | 233635.7 | −116791 | n/a | n/a | 1.128879 | 0.346618 | 0.284472 | 0.171901 | 0.19701 |
| TN93 | 24 | 234233.5 | 233995.3 | −116974 | n/a | n/a | 1.126875 | 0.346618 | 0.284472 | 0.171901 | 0.19701 |
| HKY | 23 | 234433.4 | 234205.2 | −117080 | n/a | n/a | 1.120824 | 0.346618 | 0.284472 | 0.171901 | 0.19701 |
| T92 | 21 | 234487 | 234278.6 | −117118 | n/a | n/a | 1.128003 | 0.315545 | 0.315545 | 0.184455 | 0.184455 |
| JC+G + I | 21 | 236343.7 | 236135.3 | −118047 | 0.197968 | 2.15123 | 0.5 | 0.25 | 0.25 | 0.25 | 0.25 |
| JC+G | 20 | 236429.5 | 236231 | −118096 | n/a | 0.760986 | 0.5 | 0.25 | 0.25 | 0.25 | 0.25 |
| JC+I | 20 | 236536.2 | 236337.8 | −118149 | 0.275343 | n/a | 0.5 | 0.25 | 0.25 | 0.25 | 0.25 |
| K2 | 20 | 238246.4 | 238047.9 | −119004 | n/a | n/a | 1.231031 | 0.25 | 0.25 | 0.25 | 0.25 |
BIC: Bayesian information criterion, AICc: Corrected Akaike Information Criterion, InL: Natural Logarithm of the Likelihood
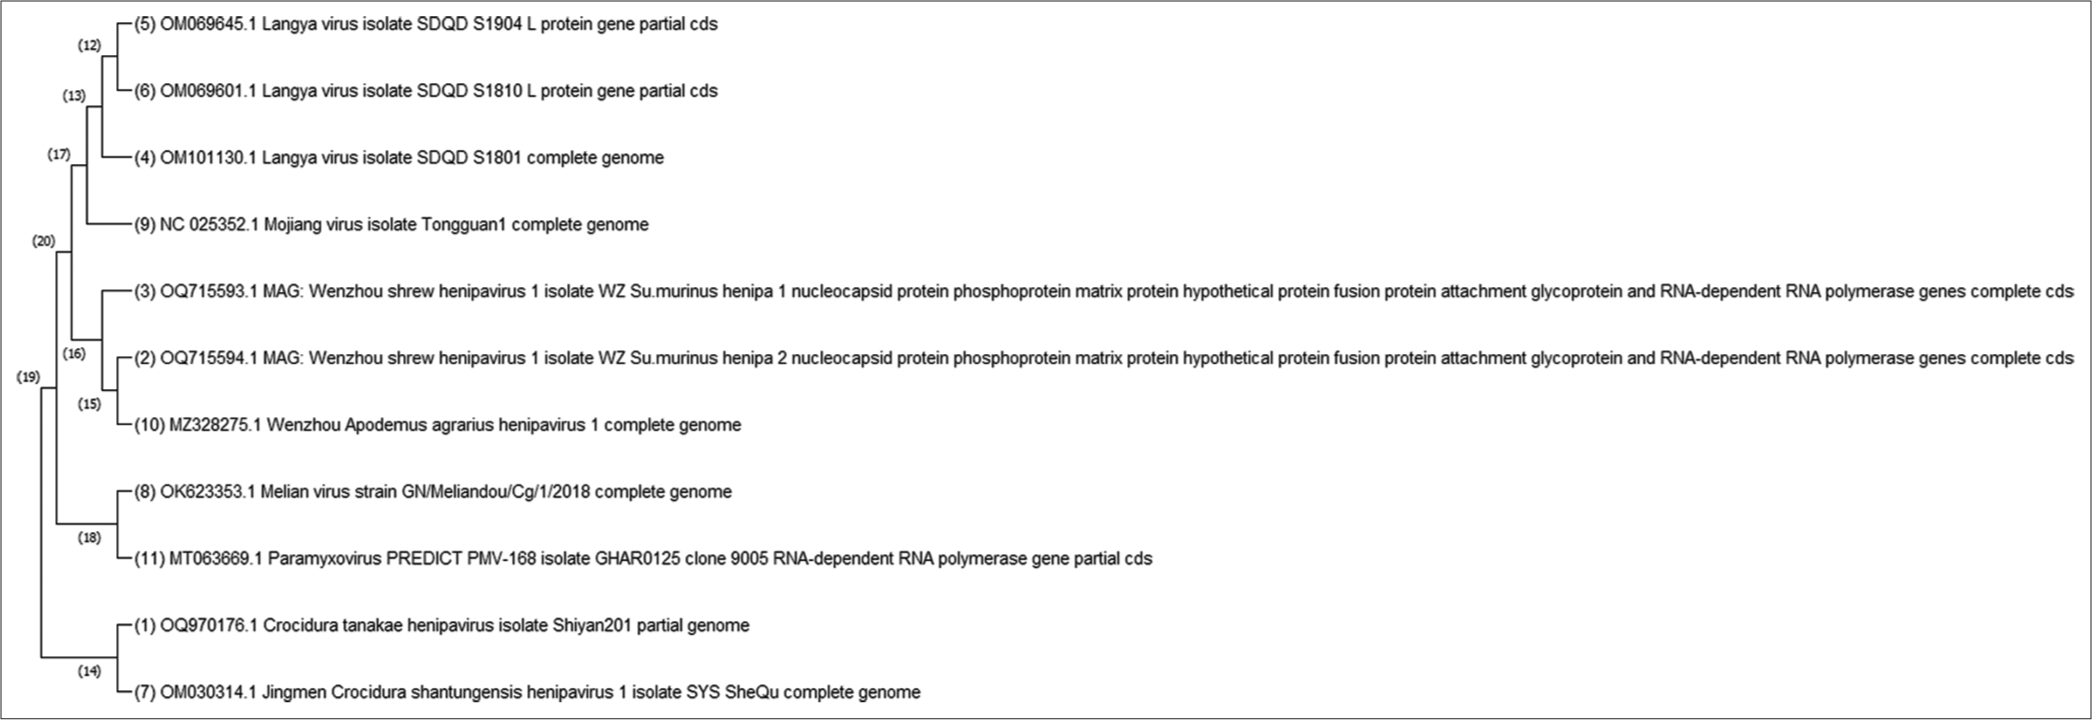
- Illustrates the Maximum Likelihood relationship among various species in the Worldwide collection, with a focus on Langya Virus sp (LayV). LayV is intricately associated with paramyxovirus, mojinga virus, hernipavirus, and melian virus within this context. MAG: Metagenome-assembled genome, GHA: Genome-Wide haplotypic association, SYS: Systems biology, RNA: Ribonucleic acid.
The phylogenetic analysis was conducted employing MEGA5 software, wherein a multiple alignment file served as the foundational dataset. The analysis, encompassing 70 nucleotide sequences, aimed at elucidating the evolutionary relationships among the strains. The Kimura 2-parameter model, integrated with the ML method, facilitated the inference of the evolutionary history. Robustness of the results was ensured through a bootstrap analysis of 1000 replicates. To initiate the heuristic search, automatic generation of initial trees involved the application of the Neighbour-Joining and BioNJ algorithms were applied to a pairwise distance matrix generated using the Maximum Composite Likelihood method. The selection of the topology with the highest log-likelihood value further refined the analysis. Notably, positions featuring gaps or missing data were meticulously eliminated to enhance data reliability. The resultant phylogenetic tree, presented in Figure 2, exhibited a discernible clustering pattern. Specifically, all native strains formed an evolutionary cluster alongside Paramyxovirus, while other LayV species were distinctly grouped based on relatedness. The tree, drawn to scale, expressed branch lengths in substitutions per site, providing a comprehensive visual representation of the evolutionary landscape.
The mean (relative) evolutionary rates, calculated using the Kimura 2-parameter model, were normalized to the average evolutionary rate across all sites. Consequently, sites with a rate <1 are evolving at a pace slower than the average, while those with a rate >1 are evolving more rapidly than the overall average. The estimated value of the shape parameter for the discrete gamma distribution is 0.5674. Substitution pattern and rates were estimated under the Tamura-Nei (1993) model (+G). A discrete gamma distribution was used to model evolutionary rate differences among sites (5 categories, [+G]). Mean evolutionary rates in these categories were 0.03, 0.19, 0.52, 1.14, 3.12 substitutions per site. The nucleotide frequencies are A = 34.66%, T/U = 28.45%, C = 17.19%, and G = 19.70%. For estimating ML values, a tree topology was automatically computed. The maximum log likelihood for this computation was −114066.116. This analysis involved 11 nucleotide sequences. Codon positions included were 1st+2nd+3rd+noncoding [Figure 3]. There were a total of 21134 positions in the final dataset. Evolutionary analyses were conducted in MEGA X.
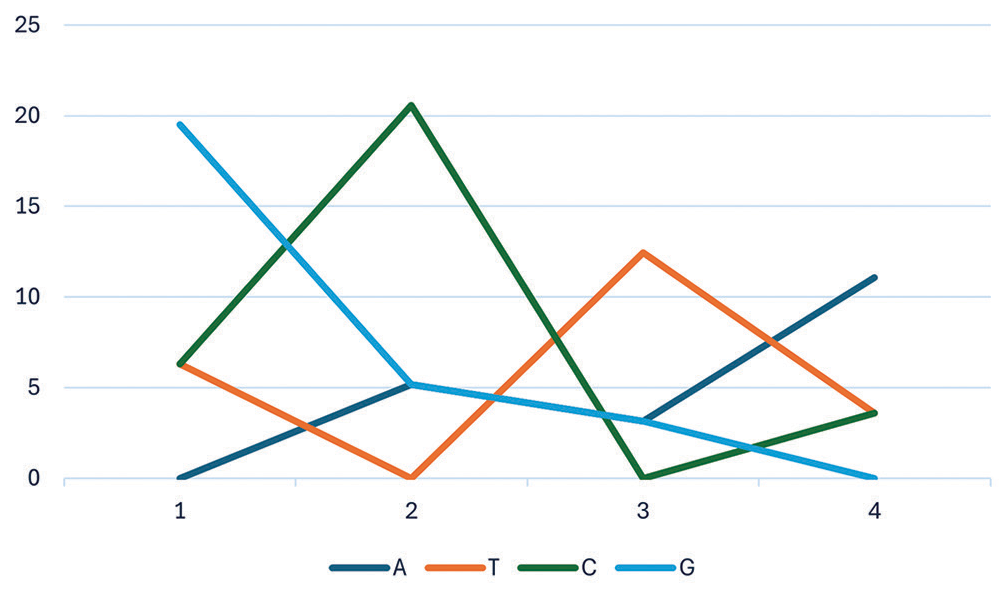
- Representation of nucleotide frequencies (A, T, G, C) for constructing Maximum Likelihood (ML) phylogeny. A,T,G,C stands for adenine (A), thymine (T), guanine (G), and cytosine (C).
The results obtained from Tajima’s test for a set of three sequences reveal valuable insights into the genetic variation among them. Among the scrutinized sites, a substantial number of 9718 were identified as identical across all three sequences, indicating a high level of conservation [Table 2]. Conversely, 177 sites exhibited divergence in all three sequences, suggesting instances of genetic variation within the shared regions. Notably, Sequence A displayed 6523 unique differences, implying a distinct genetic makeup, while Sequence B and Sequence C presented 166 and 203 unique differences, respectively. These unique differences underscore the individualistic genetic signatures of each sequence. This comprehensive analysis provides a nuanced understanding of both shared and distinctive genetic features among the three sequences, contributing to a more holistic interpretation of their genetic relationships.
| Configuration | Count |
|---|---|
| Identical sites in all three sequences | 9718 |
| Divergent sites in all three sequences | 177 |
| Unique differences in sequence A | 6523 |
| Unique differences in sequence B | 166 |
| Unique differences in sequence C | 203 |
The molecular evolution analysis of the Paramyxovirus sp population demonstrated a close relationship with LayV, providing robust support for the native strain’s topology. Within this investigation, the concept of selection pressure driving molecular evolution was posited. The findings of the current analysis highlighted a noteworthy trend: A significant proportion of sites in the 16S rDNA region evolved at a markedly slower rate than the average. In addition, the nucleotide diversity across the entire population was observed to be very low, and the Tajima test statistic value (D) showed a slight positive inclination. These results suggest two plausible scenarios: Either the population may have undergone a recent bottleneck or is experiencing a decrease, or there might be evidence pointing to over-dominant selection at this specific locus. These nuanced insights contribute to a more comprehensive understanding of the dynamic forces shaping the molecular evolution of the paramyxovirus sp population.
Homology modeling
In the pursuit of unraveling the intricacies of LayV proteins (C, L, V, W), structures were generated from the corresponding FASTA sequences, derived both from the target proteins and template structures chosen for homology modeling, a rigorous examination ensued using SWISS-MODEL and AF. This encompassing analysis delved into various quality metrics, including the precision of folding, identification of steric clashes among unpaired atoms, and the residue-wise stereochemical integrity of the protein structure, as depicted in Figure 4. The subsequent phase involved a detailed scrutiny of the structural data, initially focusing on the accuracy of predicting functional sites, such as binding sites. This step was crucial in assessing the model’s reliability in capturing biologically relevant features. Subsequently, the efficacy of both in silico approaches was meticulously evaluated, considering their overall performance in generating reliable protein structures.

- Displays three-dimensional modeled structures of (a) C, (b) L, (c) V, (d) W proteins of Langya Virus generated using Swiss Model. In this representation, α-helices, β-strands, and loops are distinctly colored in red, blue, and green, respectively.
Comparative analysis of homology models and AF structures: Assessing structural integrity and discrepancies
The validation of the model, encompassing the geometric properties of the backbone conformations, was meticulously scrutinized through diverse structure evaluation programs. Figure 5 illustrates the Ramachandran plot for the three models, with the SM showcasing notable results. This model evaluates the permissible torsional angles for amino acid residues in protein backbones. Specifically, C and L exhibit the most favorable outcomes, with 93.2% and 89.4% of residues residing in favored regions, respectively. In contrast, V and W also display best result, with 82.0% and 87.5%, respectively. This insightful analysis enhances our understanding of the model’s structural integrity and informs potential refinements for optimal performance.
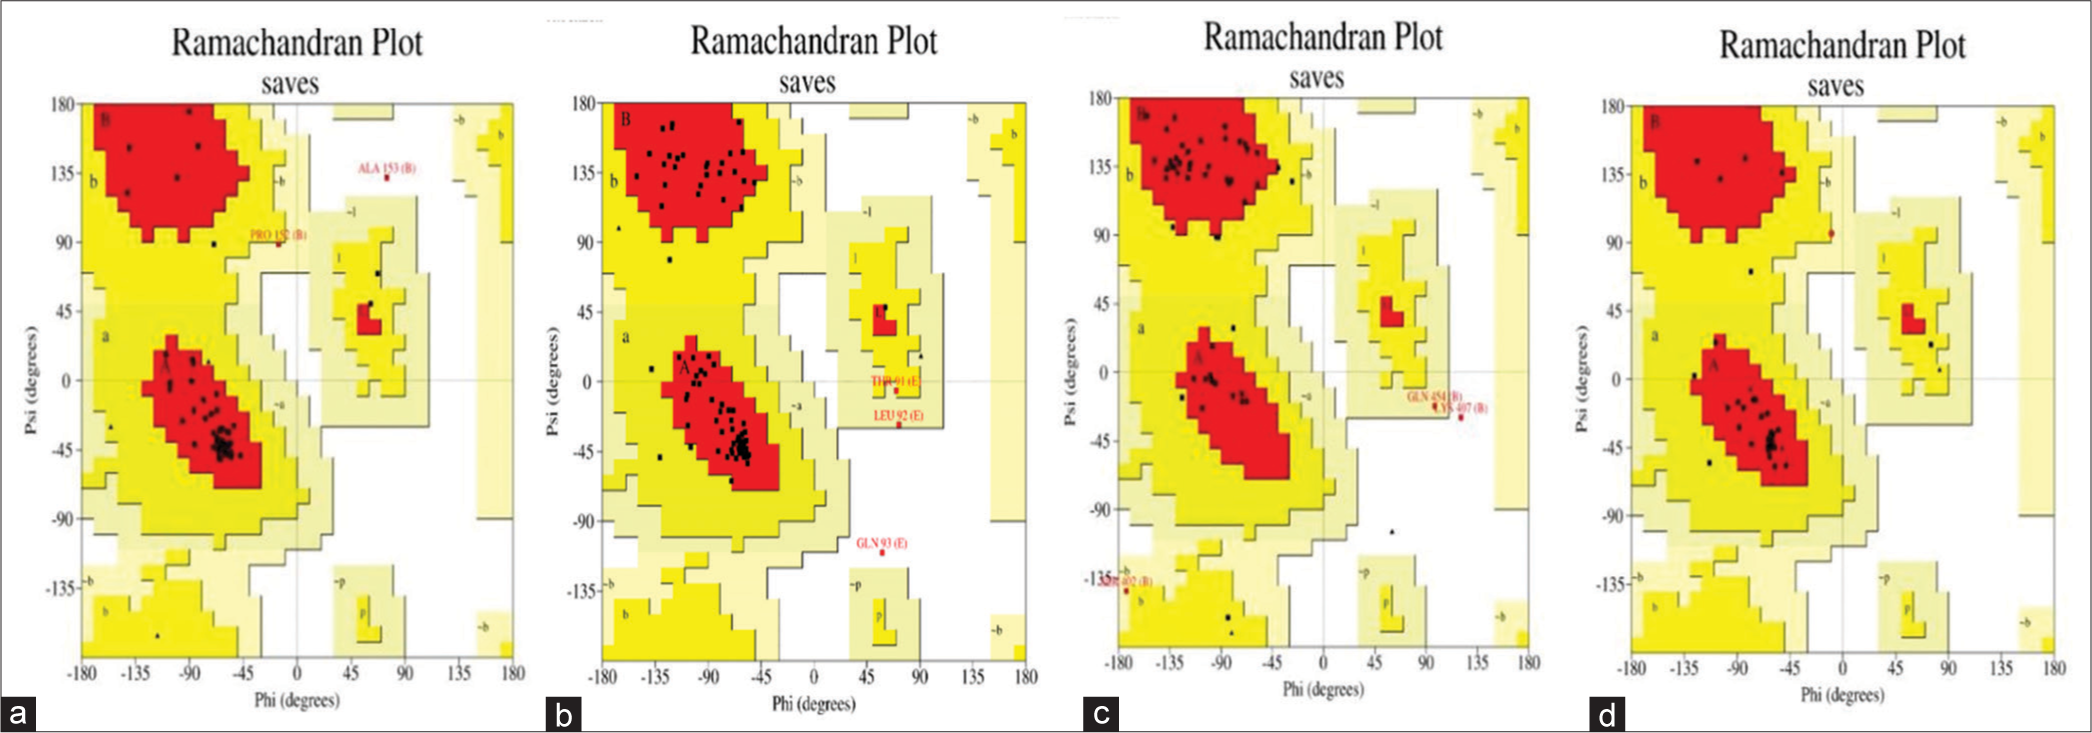
- Illustrates the Ramachandran Plot post-refinement for the modeled proteins, including (a) C protein, (b) L protein, (c) V protein, and (d) W protein of Langya Virus. In this depiction, the favored, allowed, and disallowed regions are represented by red, yellow, and white regions, respectively. This visualization provides a comprehensive overview of the torsional angles of amino acid residues in the refined protein structures.
Table 3 provides a thorough comparative analysis of four protein models (C, L, V, and W) employing the ERRAT and Verify_3D validation tools, offering valuable insights into packing quality and adherence to physical-chemical principles. Notably, C and L emerge as frontrunners with impressive ERRAT scores of 87.5% and 89.2% [Figure 6], indicating superior packing and efficient residue interactions. The corresponding Verify_3D scores of 86.5% and 85.4% further substantiate their robust structural integrity. V presents a nuanced scenario with a commendable ERRAT score of 88.46 but a slightly lower Verify_3D score of 87.3, suggesting potential packing or chemical inconsistencies. Conversely, W raises concerns with significantly lower ERRAT (77.4) and Verify_3D (78.4) scores, underscoring stability issues. In summary, C and L showcase high structural integrity, V demands additional scrutiny, and W warrants further investigation and potential refinement for enhanced accuracy. The inclusion of ProSA [Figures 7-9] and QE assessments reinforces the SM’s superiority compared to other proteins, underscoring its efficacy in structural development [Figure 10].
| Name of the Protein | Validations | After modeling | Refine loop | Minimize | Predict side chain | |
|---|---|---|---|---|---|---|
| C Protein | Ramachandran Plot | Favored regions | 93.2 | 93.2 | 90.2 | 88.4 |
| Additional allowed regions | 5.1 | 3 | 2 | 3 | ||
| Generously allowed regions | 0 | 0 | 0 | 0 | ||
| Disallowed regions | 1.7 | 1 | 1 | 1.2 | ||
| Errat | 87.5 | 91 | 95.1 | 89.1 | ||
| Verify_3D | 86.5 | 88.5 | 88.1 | 85 | ||
| Prove_z-score | 0.6 | 0.5 | 0.58 | 0.54 | ||
| L Protein | Ramachandran Plot | Favored regions | 89.4 | 90.2 | 88.5 | 87.5 |
| Additional allowed regions | 7.1 | 6.8 | 6.5 | 6.9 | ||
| Generously allowed regions | 2.4 | 1.7 | 2.5 | 2.6 | ||
| Disallowed regions | 1.2 | 1.1 | 1.7 | 1.8 | ||
| Errat | 89.2 | 89.9 | 88.5 | 87.4 | ||
| Verify_3D | 85.4 | 84.8 | 84.5 | 86.7 | ||
| Prove_z-score | 0.7 | 0.73 | 0.68 | 0.74 | ||
| V Protein | Ramachandran Plot | Favored regions | 82.0 | 83 | 82.5 | 81.8 |
| Additional allowed regions | 12.0 | 11 | 11.5 | 12.5 | ||
| Generously allowed regions | 4.0 | 3 | 2 | 4.4 | ||
| Disallowed regions | 2.0 | 3 | 4 | 2.1 | ||
| Errat | 88.46 | 88.32 | 87.5 | 85.9 | ||
| Verify_3D | 87.3 | 86.9 | 87.4 | 85.5 | ||
| Prove_z-score | 0.66 | 0.67 | 0.59 | 0.62 | ||
| W Protein | Ramachandran Plot | Favored regions | 87.5 | 87.9 | 87.2 | 86.8 |
| Additional allowed regions | 12.5 | 12.1 | 12.8 | 12.8 | ||
| Generously allowed regions | 0.0 | 0.1 | 0 | 2.4 | ||
| Disallowed regions | 0.0 | 0 | 0 | 0.1 | ||
| Errat | 77.4 | 78.4 | 77.2 | 77.5 | ||
| Verify_3D | 78.4 | 78.9 | 77.5 | 77.3 | ||
| Prove_z-score | 0.422 | 0.45 | 0.54 | 0.45 |
This table presents a detailed analysis of your models’ structural integrity, assessed through a battery of validation tools. Procheck, ProQ, and ERRAT zoom in on backbone angles, overall quality, and packing efficiency, respectively. Verify_3D ensures adherence to physical principles, while Prove and ProSA scrutinize “protein-likeness” and potential errors. Finally, Z-scores benchmark your models against known structures. Comparing scores across these tools reveals each model’s strengths and weaknesses, paving the way for informed refinement and a deeper understanding of their structural validity

- ERRAT plots paint a stark contrast: (a) C and (b) L bask in the high-confidence zones, their packing near-flawless, while (c) V dips into uncertainty, and (d) W plunges, suggesting potential instability. This packing quality spectrum highlights the need for tailored validation across protein models. *: Likely indicates that the “Error value” represents a specific measure of structural quality, such as deviation from ideal geometry or model accuracy. The exact metric is typically defined in the methods or legend. White bars: These may represent residues within an acceptable quality threshold, indicating areas of the protein structure with lower error values and, thus, reliable structural quality. Yellow bars: Likely highlight residues with higher error values, suggesting regions in the protein structure with potential issues or instability, which may need further refinement or indicate areas of flexibility.

- Displays residue energy plots for proteins generated by the Swiss model, with specific representations for (a) C, (b) L, (c) V, and (d) W proteins. The green lines indicate residue energy levels.
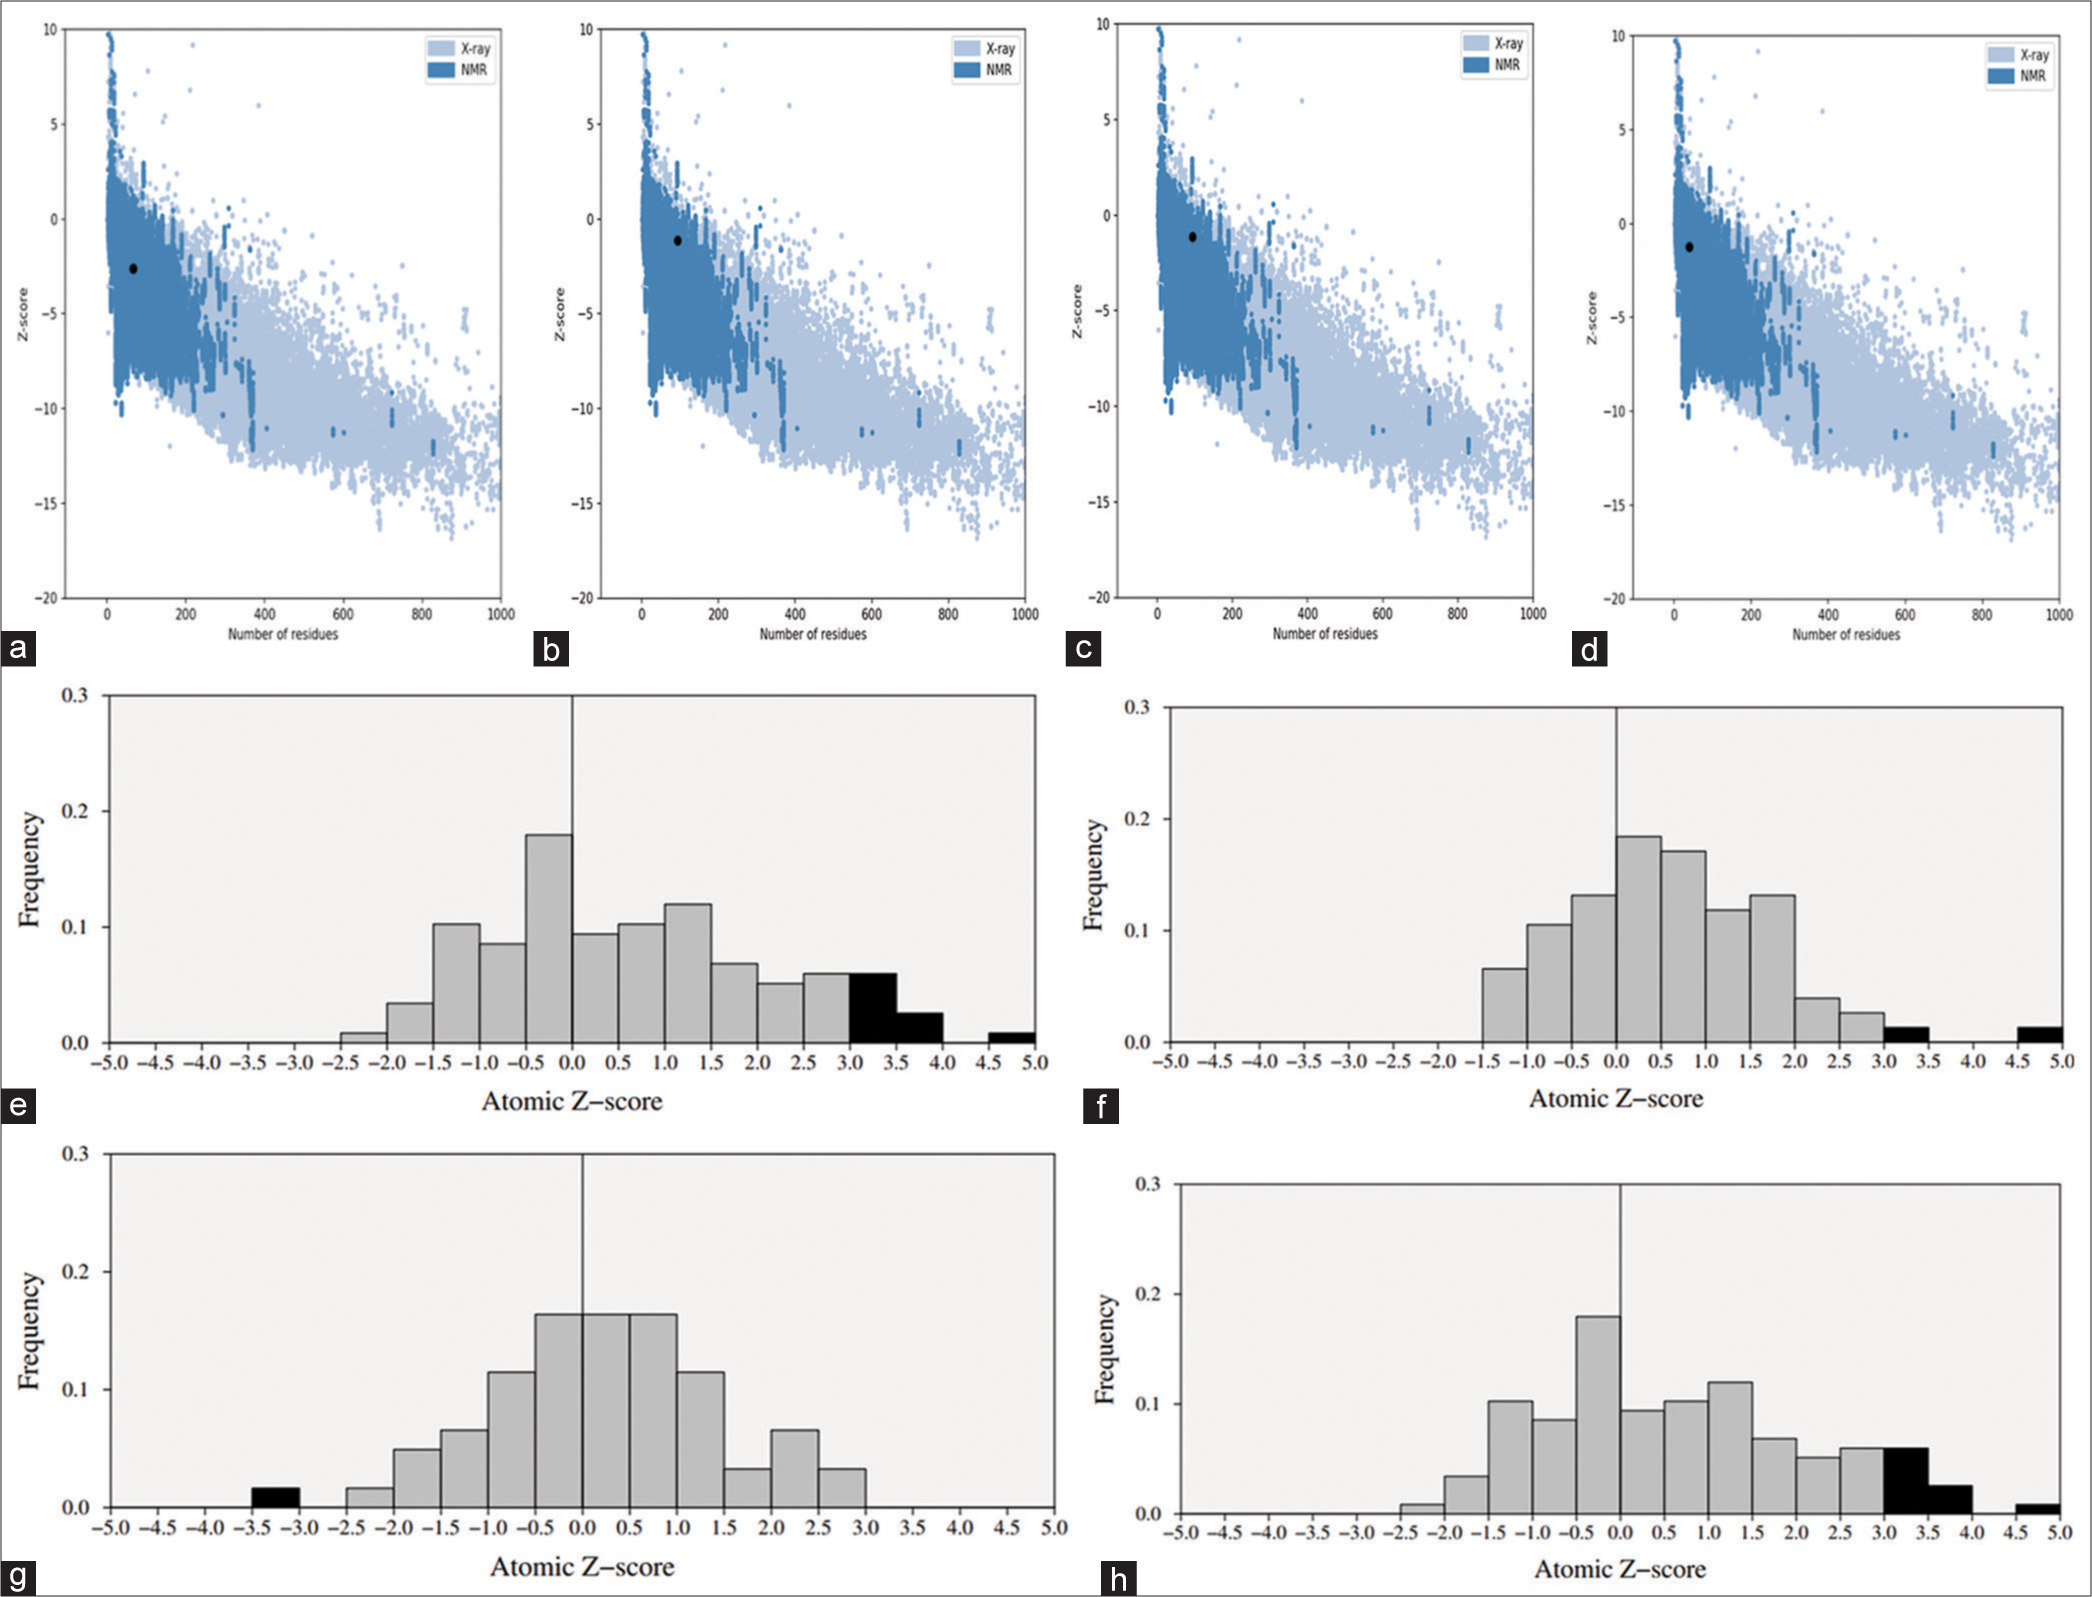
- ProSA-web Z-scores and Frequency for the Swiss model (indicated by black spots) concerning (a) C, (b) L, (c) V, and (d) W proteins, (e) C protein, (f) L protein, (g) V protein and (h) W protein. These Z-scores are compared to all protein chains in the protein data bank determined through X-ray crystallography (represented in light blue) or NMR spectroscopy (depicted in dark blue), considering their respective lengths.
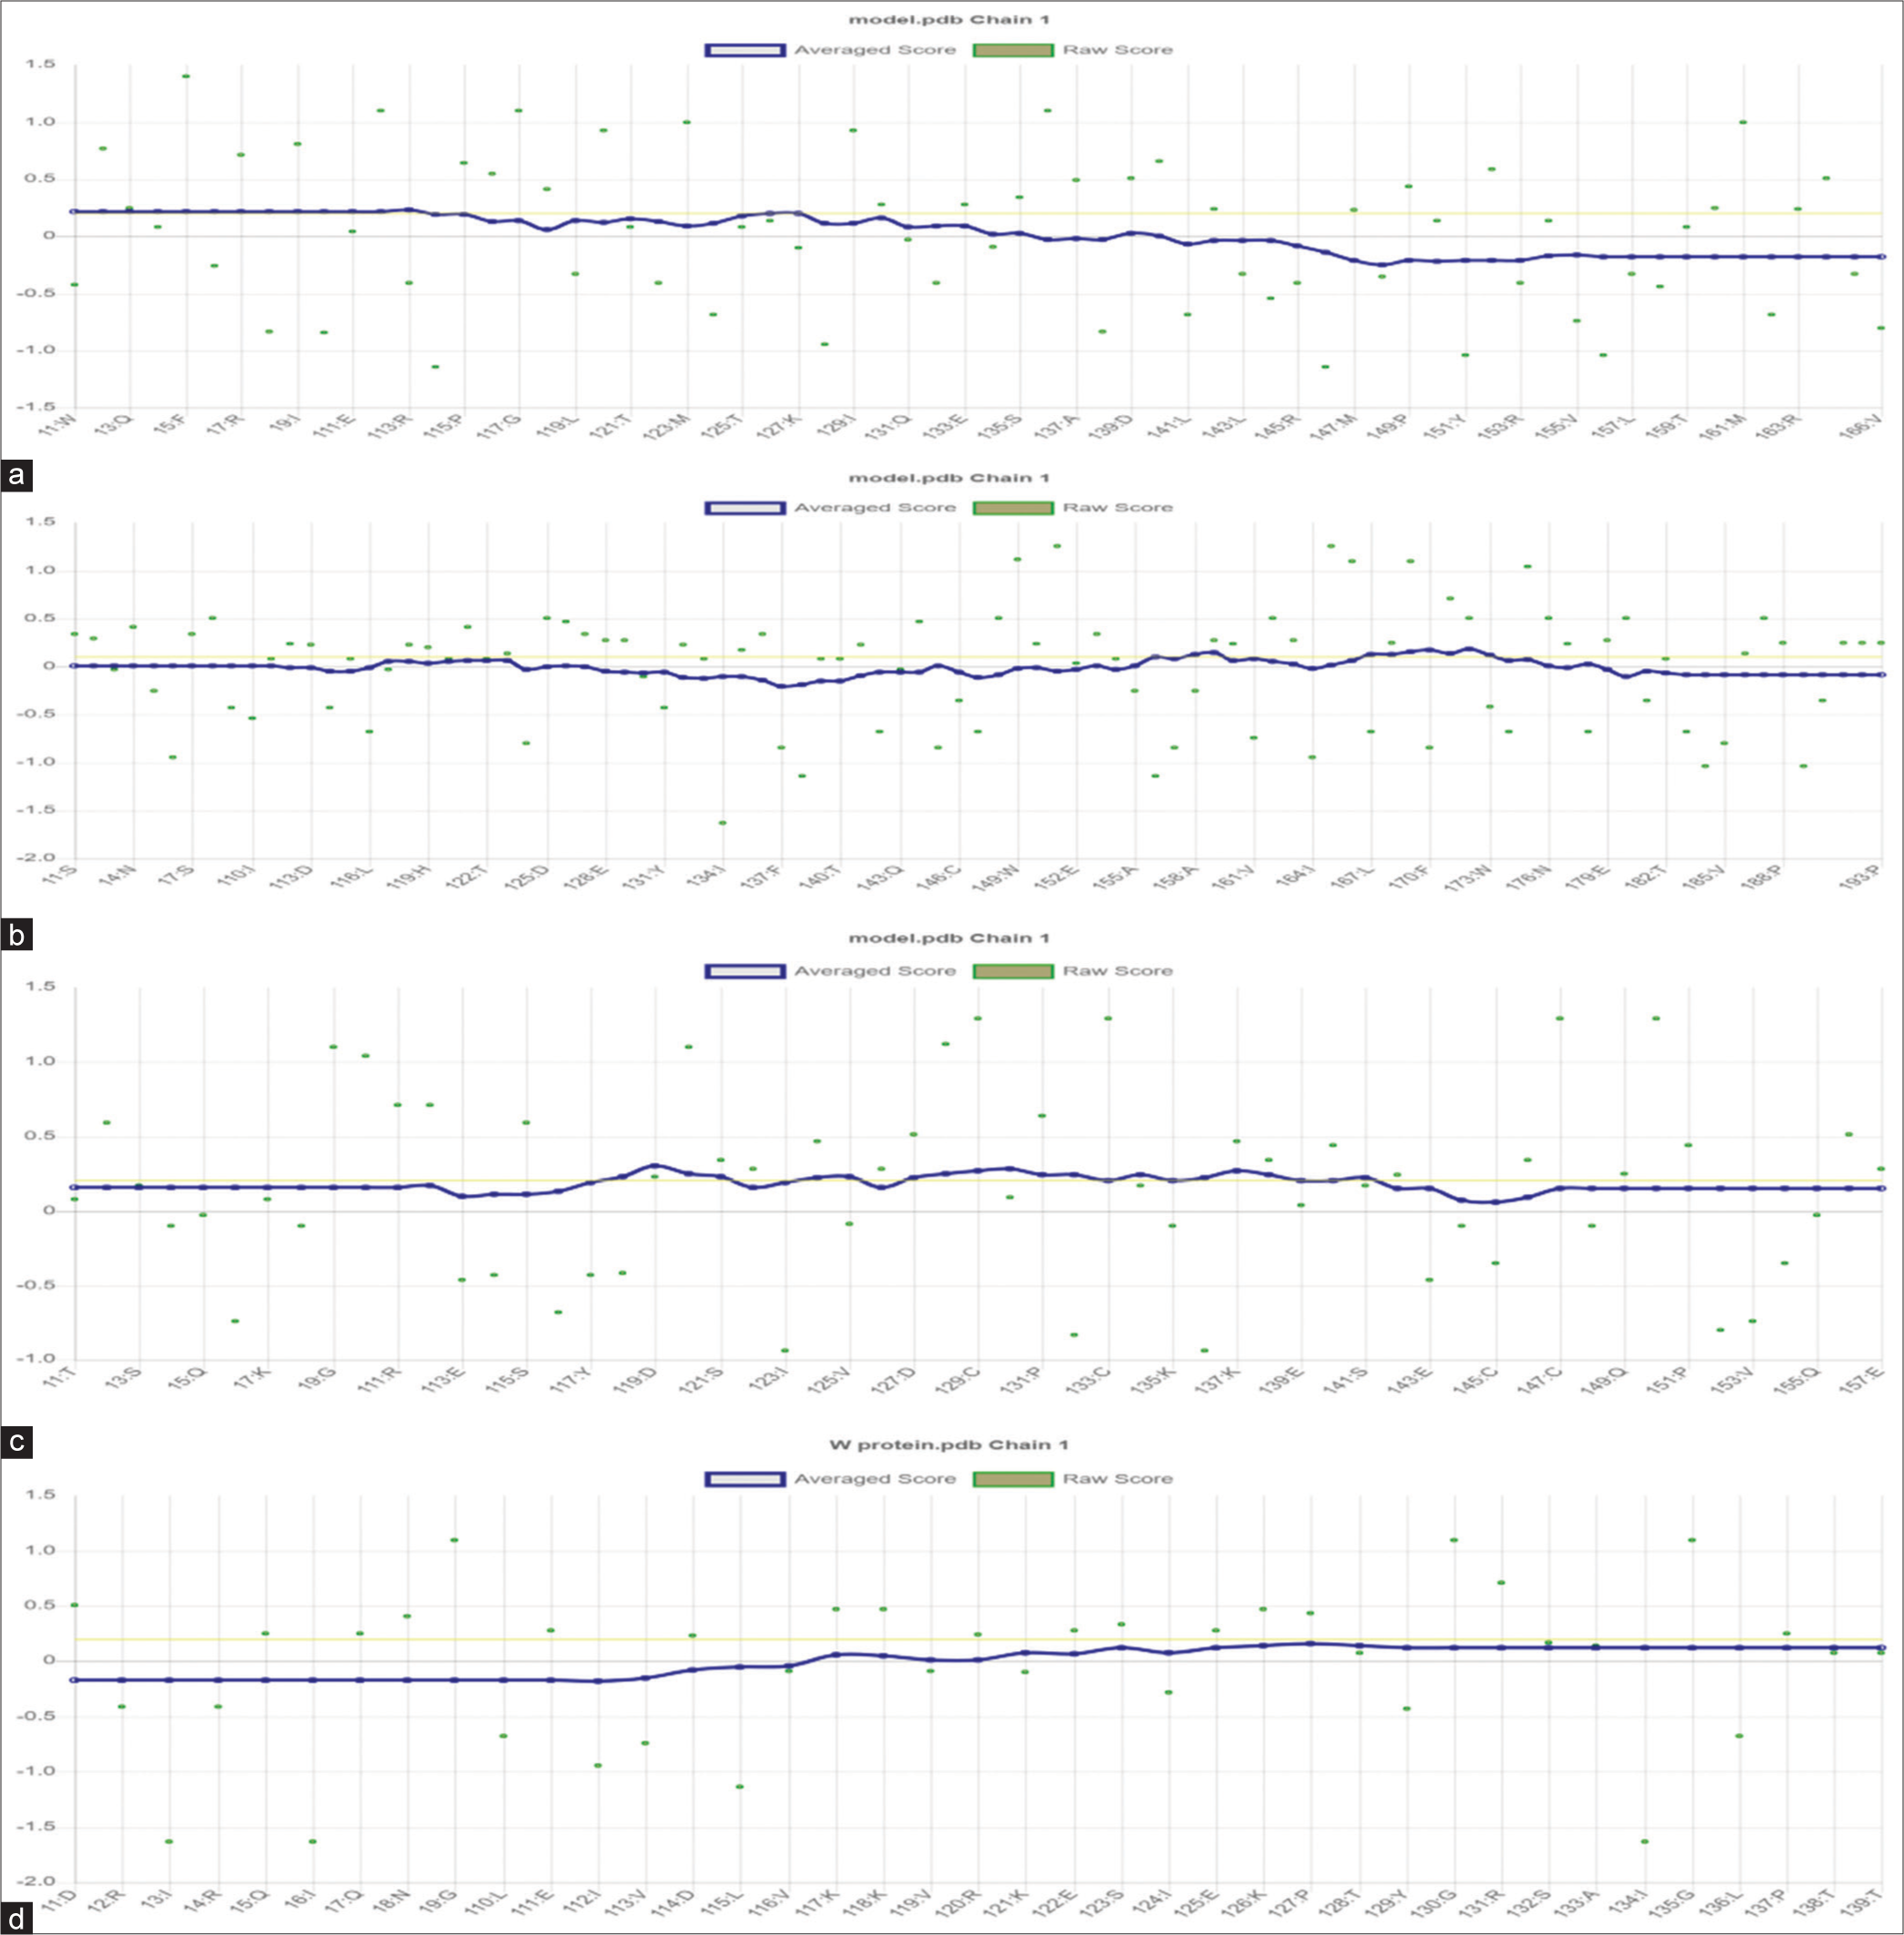
- Verify_3D plots for proteins generated by the Swiss model, with specific representations for (a) C, (b) L, (c) V, and (d) W proteins.
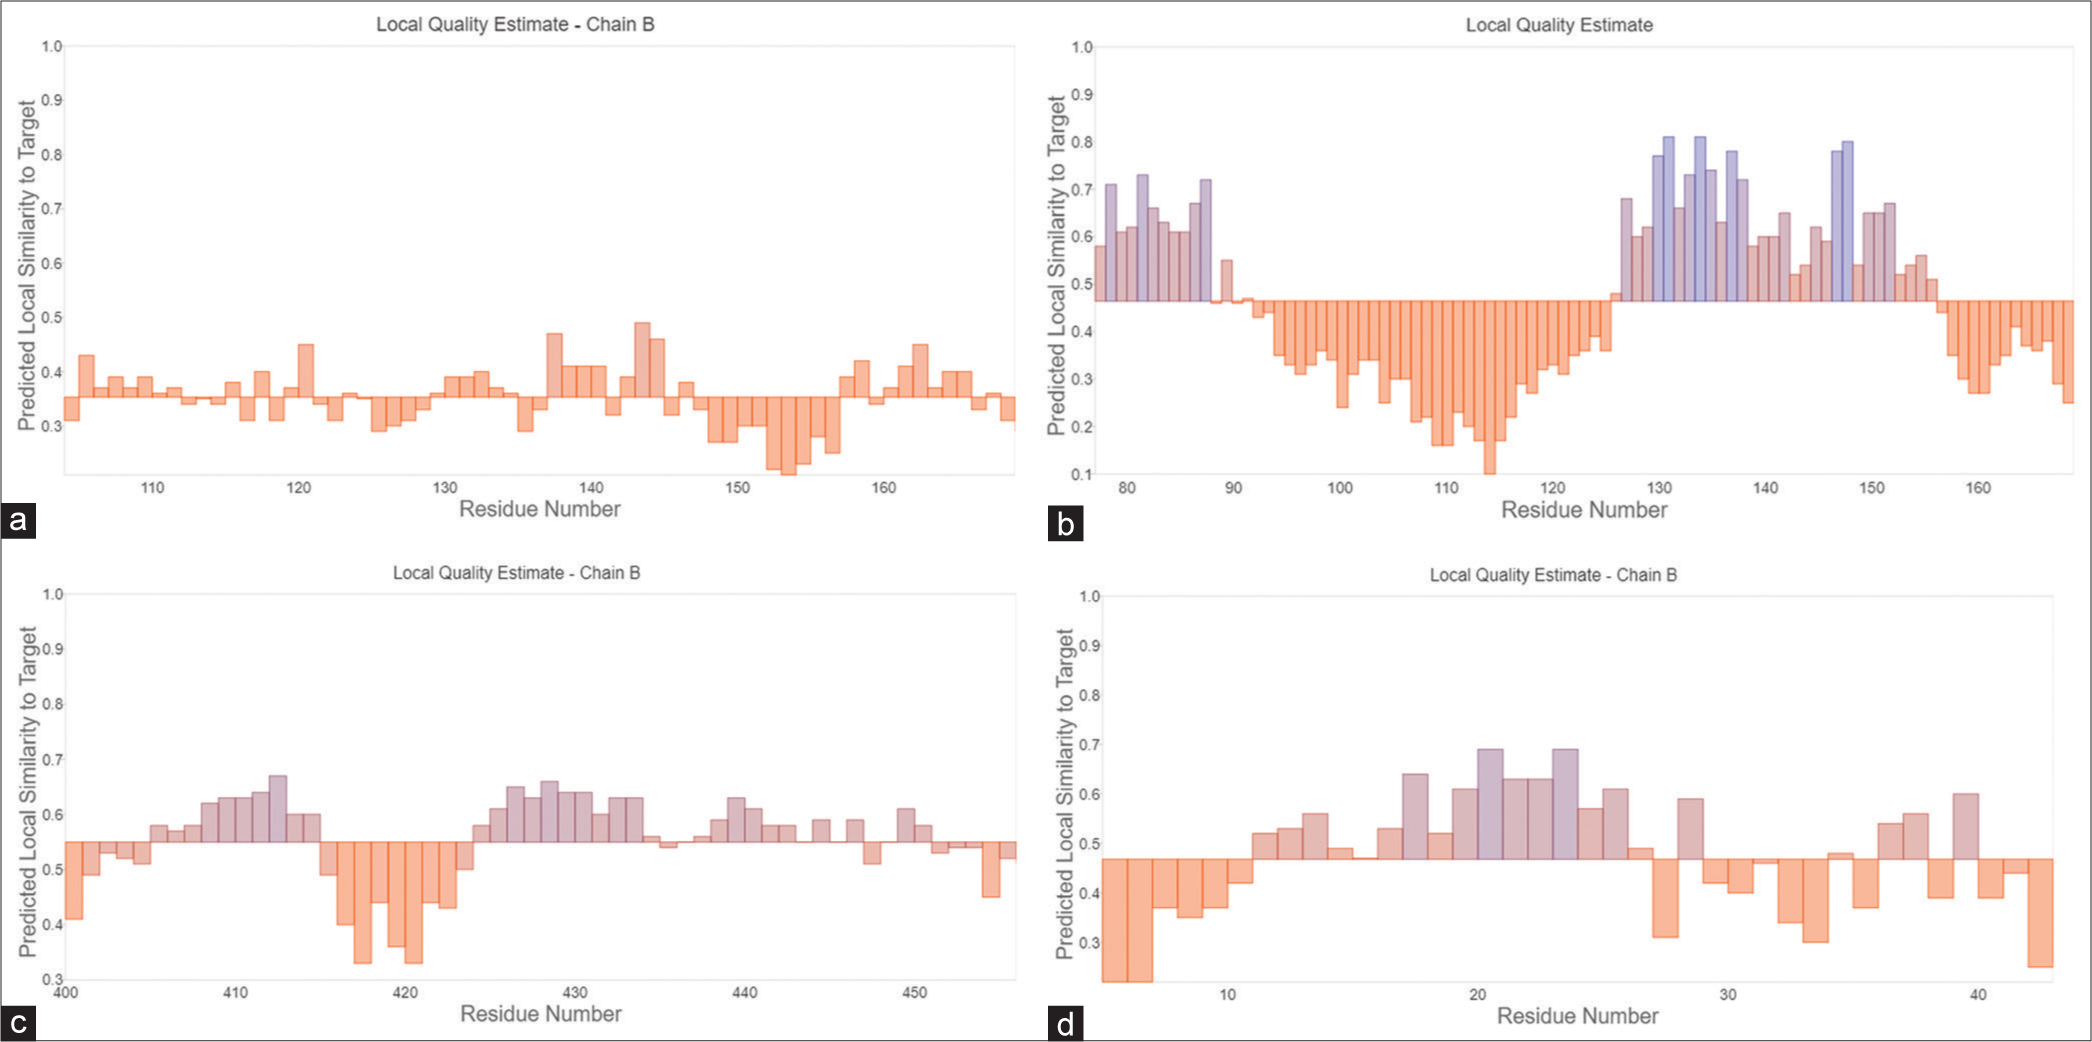
- The analysis encompasses side chain prediction accompanied by quality estimate plots for proteins generated through the Swiss model. This investigation provides detailed insights into residue quality, with dedicated representations for (a) C, (b) L, (c) V, and (d) W proteins. Orange Bars: These represent regions of lower predicted local similarity to the target structure. Blue Bars: These represent regions of Higher predicted local similarity to the target structure.
DISCUSSION
Evaluation of the AlphaFold structural models
The C protein
The structural analysis reveals the outstanding quality of the C protein model generated by Swiss, boasting an impressive 91% accuracy in the allowed region and demonstrating fewer disallowed regions compared to the AlphaFold structure [Figure 11]. This exceptional performance is substantiated through a detailed examination, particularly emphasized in Figure 12 Ramachandran plot. The plot vividly illustrates the C protein model’s adherence to preferred torsional angles for amino acid residues, showcasing a predominant presence in the allowed region, indicative of its robust structural integrity. In contrast, the AlphaFold structure exhibits a lower accuracy in the allowed region, emphasizing the superior conformational accuracy achieved by the SM. This comprehensive analysis reinforces the conclusion that the C protein model from Swiss excels in both accuracy and minimized disallowed regions, establishing its superiority over the AlphaFold structure in terms of structural quality.

- Displays three-dimensional modeled structures of (a) C, (b) L, (c) V, and (d) W proteins of Langya Virus generated using Alpha Fold. The representation highlights α-helices in red, β-strands in yellow, and loops in blue and green, providing a visually distinct and informative depiction of the protein structures.

- The Ramachandran plot depicts the post-refinement status of the modeled proteins, encompassing (a) C protein, (b) L protein, (c) V Protein, and (d) W protein. Within this representation, the favored, allowed, and disallowed regions are denoted by red, yellow, and white areas, respectively. This visualization offers a comprehensive overview of the torsional angles of amino acid residues within the refined protein structures.
The L protein
In the structural analysis, the L protein model crafted by AF’s structure stands out as the optimal choice, boasting an impressive 89.5% accuracy in the allowed region and exhibiting fewer disallowed regions. Furthermore, the model’s predicted local distance difference test (pLDDT) score of 81.5 serves as a robust confidence measure, indicating the model’s predicted accuracy on the local Distance Difference Test for Cα (Alpha Carbon) (lDDT-Xα) metric [Table 4]. This score is instrumental in assessing the reliability of different regions within the model. Notably, regions with pLDDT >90 are deemed highly accurate and suitable for applications requiring precision, such as characterizing binding sites. Regions with pLDDT between 70 and 90 are anticipated to have a generally good backbone prediction, while those between 50 and 70 warrant caution due to lower confidence. Regions with pLDDT <50, often exhibiting a ribbon-like appearance, are indicative of potential disorder and should be approached with care. This nuanced understanding, as detailed in different analyses, including the Ramachandran plot, affirms the robustness and reliability of the L protein model produced by AF’s structure.
| Name of the Protein | Validations | After modeling | |
|---|---|---|---|
| C Protein | Ramachandran Plot | Favored regions | 71.2 |
| Additional allowed regions | 19.4 | ||
| Generously allowed regions | 7.5 | ||
| Disallowed regions | 1.9 | ||
| Hydrophobic Plot | 2.3 | ||
| pLDDT | 47.8 | ||
| L Protein | Ramachandran Plot | Favored regions | 89.5 |
| Additional allowed regions | 7.1 | ||
| Generously allowed regions | 2.4 | ||
| Disallowed regions | 1.2 | ||
| Hydrophobic plot | 2.5 | ||
| pLDDT | 81.5 | ||
| V Protein | Ramachandran plot | Favored regions | 51.8 |
| Additional allowed regions | 37.8 | ||
| Generously allowed regions | 7.7 | ||
| Disallowed regions | 2.8 | ||
| Hydrophobic Plot | 3.8 | ||
| pLDDT | 44.5 | ||
| W Protein | Ramachandran Plot | Favored regions | 52.8 |
| Additional allowed regions | 36.8 | ||
| Generously allowed regions | 7.7 | ||
| Disallowed regions | 2.8 | ||
| Hydrophobic Plot | 3.5 | ||
| pLDDT | 41.5 |
pLDDT: Predicted Local Distance Difference Test
The V protein
The V protein model crafted by the SM emerges as the optimal choice, showcasing an impressive 82.5% accuracy in the allowed region and demonstrating fewer disallowed regions. In addition, the model’s pLDDT score of 44.5 provides a confidence measure, though relatively lower, emphasizing its predicted accuracy on the lDDT-Cα metric. Notably, a comprehensive evaluation of Figures 13-16 suggests that the AF analysis figure yields lower residue estimation quality compared to the residue plot estimation of the V protein model produced by the SM, as depicted in Figure 6. This comparative assessment underscores the robustness and reliability of the V protein model generated by the SM across various analyses. As a result, we have chosen this particular model for the continuation of further studies, particularly in the realm of docking studies.
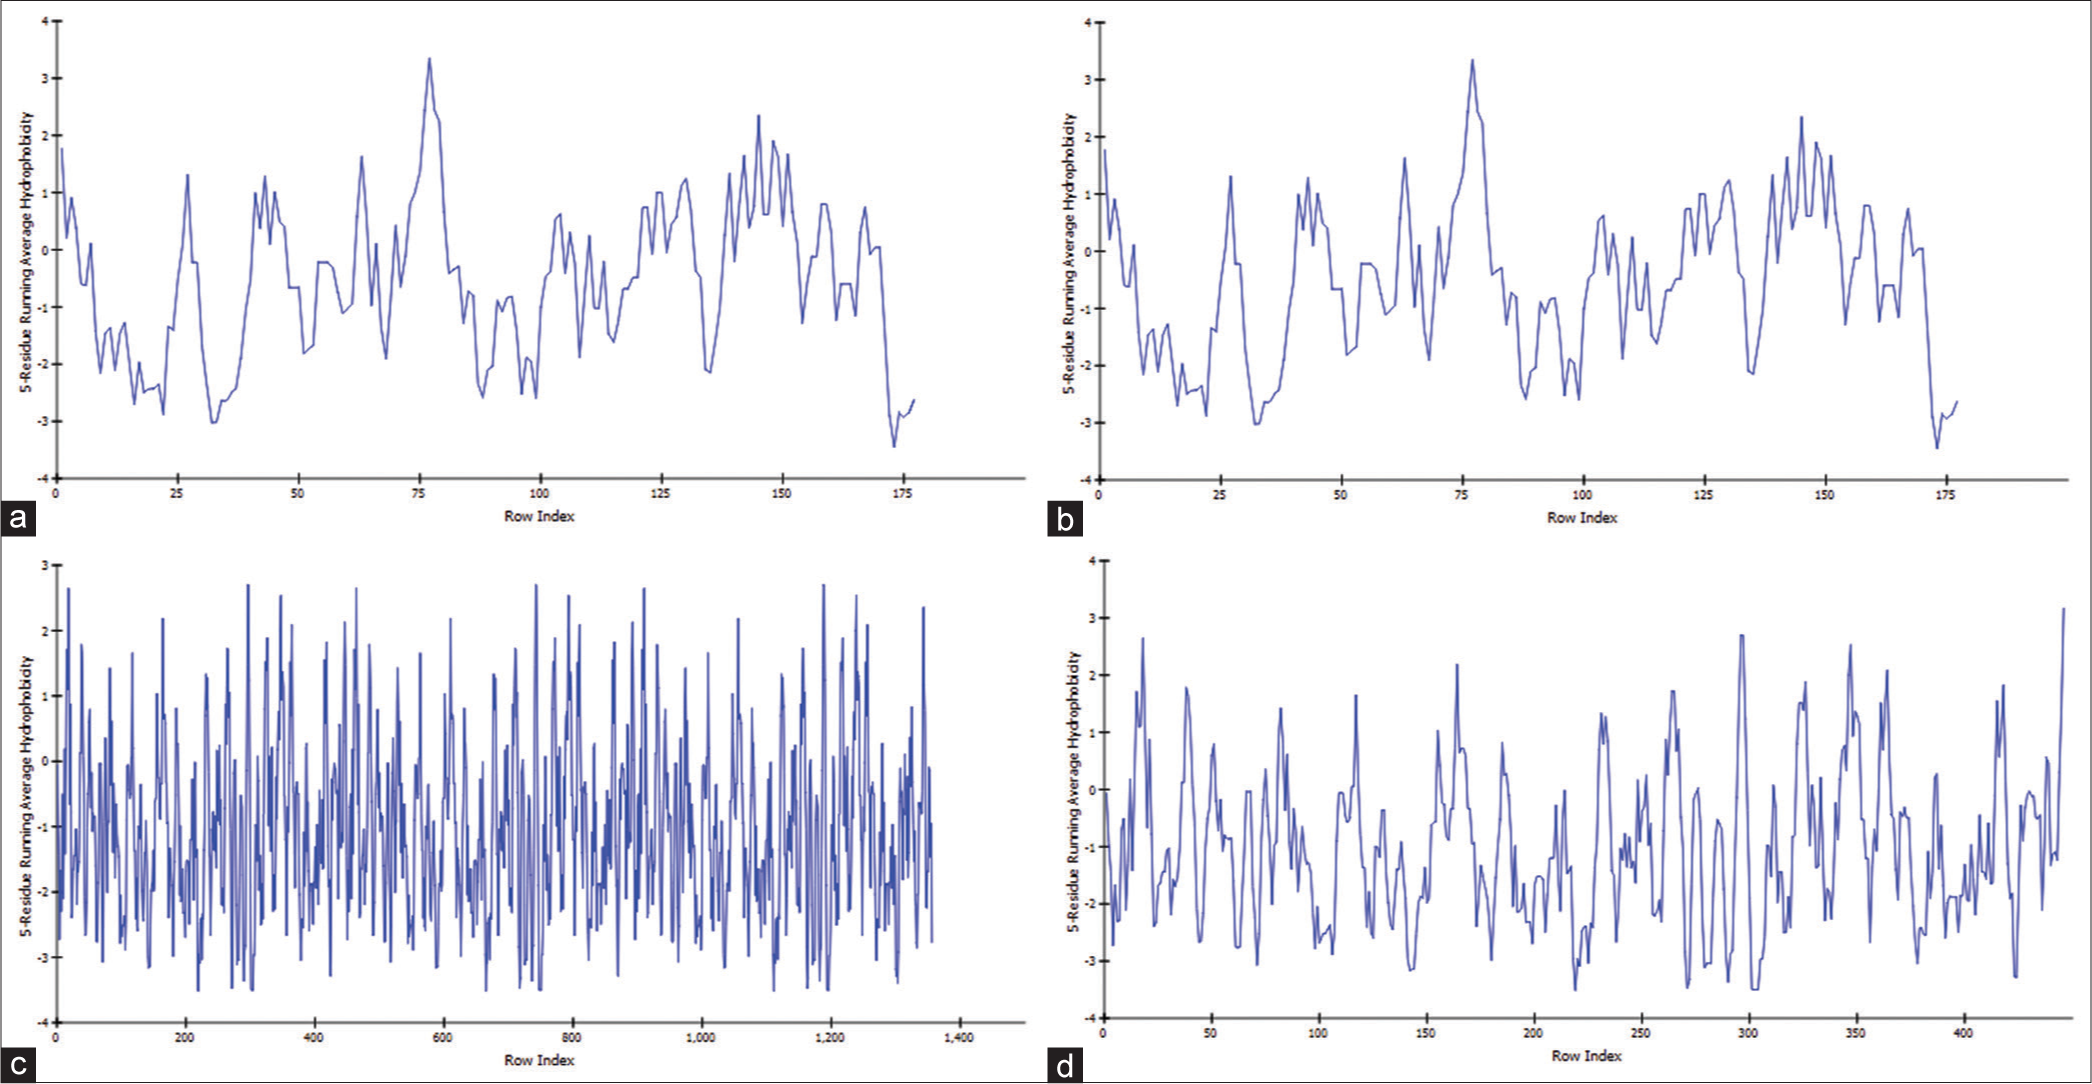
- Presents a hydrophobic plot with distinct representations for (a) C, (b) L, (c) V, and (d) W proteins, all modeled using AlphaFold within Discovery Studio.

- Sequence identity plot with distinct representations for (a) C, (b) L, (c) V, and (d) W proteins, all modeled using AlphaFold.

- Displays residue energy plots for proteins generated by the AlphaFold, with specific representations for (a) C, (b) L, (c) V, and (d) W proteins.
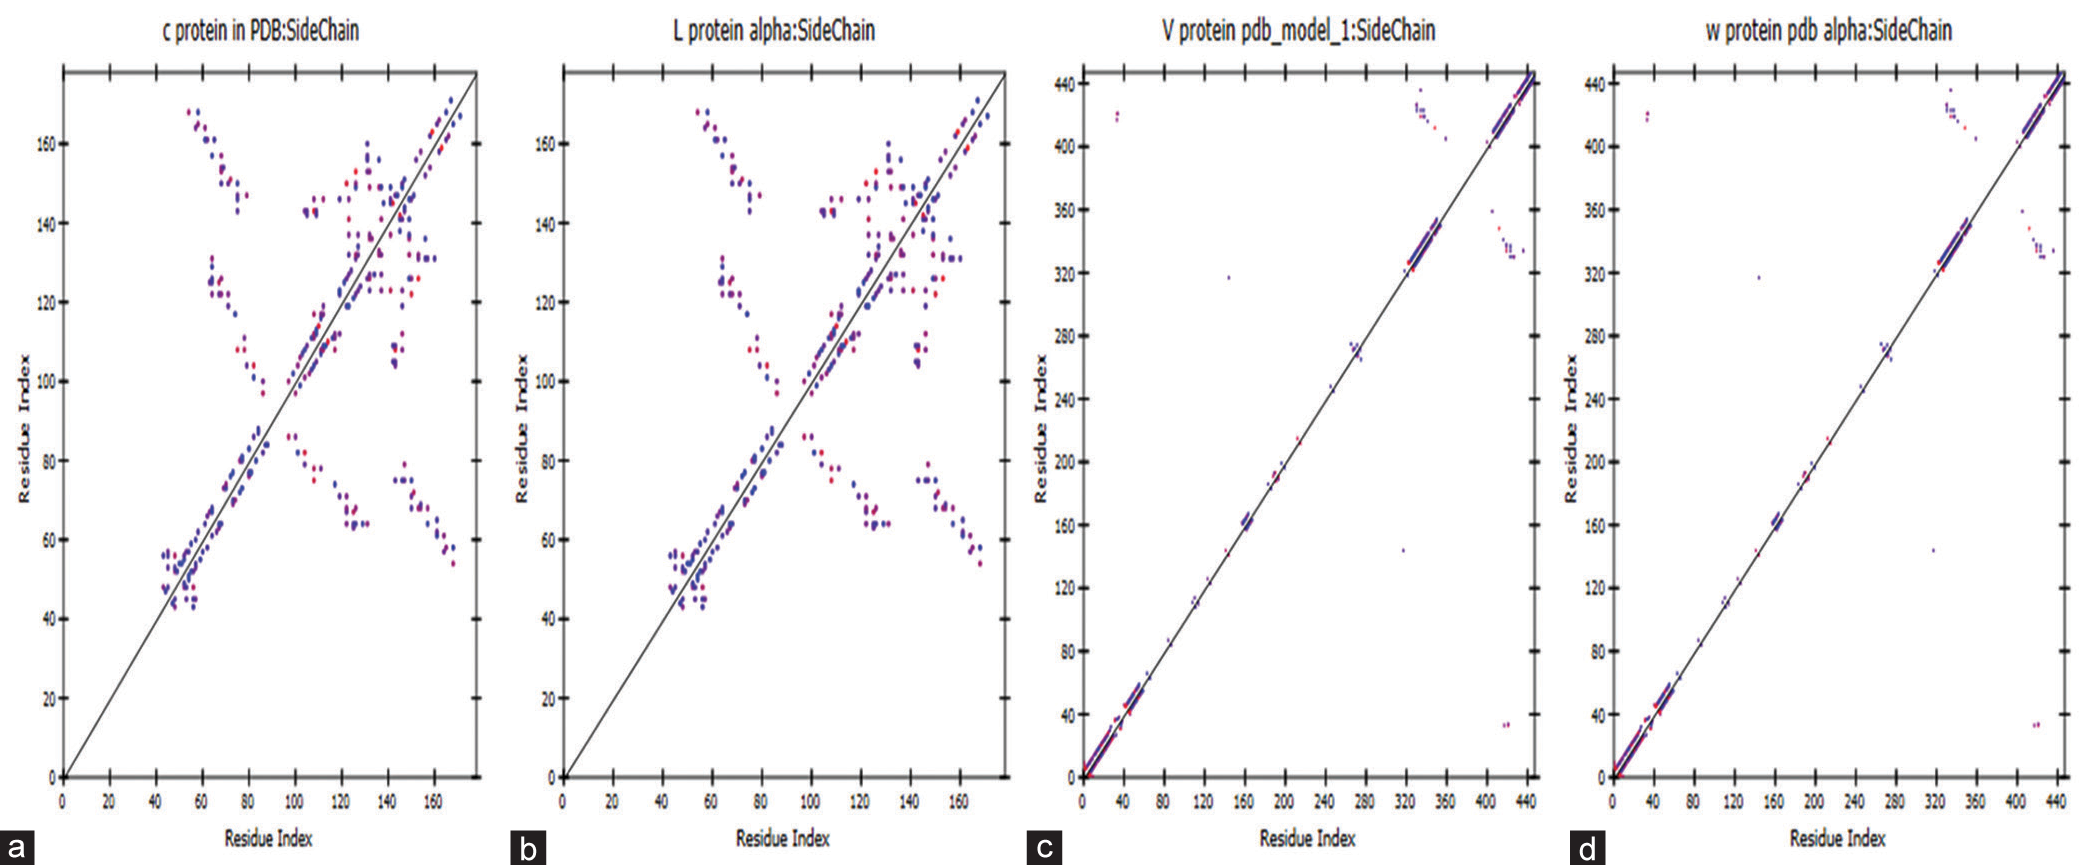
- Represents a contact plot of side chain estimation residue with distinct representations for (a) C, (b) L, (c) V, and (d) W proteins, all modeled using AlphaFold within Discovery Studio.
The W protein
Comparison of the W protein model generated by SM structure revealed superior performance in several key metrics. The model achieved an impressive 87.5% accuracy in predicting allowed regions, exhibiting a notably lower rate of disallowed regions compared to alternative approaches. Notably, the pLDDT score of 43.5 signifies enhanced model confidence. Visual analysis of Figures 13 and 14 further corroborates these findings, demonstrating reduced hydrophobic activity (3.5) and lower sequence similarity, both suggestive of a more accurate and refined model.
A thorough comparative analysis of protein structures generated by SM and AF reveals distinct strengths inherent to each platform. SM excels in the modeling of Proteins C, V, and W, showcasing higher accuracy and more precise template selection when compared to AF [Figures 15 and 16]. This proficiency can be attributed to the robust algorithm of SM, particularly well suited for homology modeling based on sequence similarity. Conversely, AF proves highly effective for Protein L, demonstrating precise residue count and favorable Z-score and root mean square deviation values, as detailed in Table 5. Recognizing these complementary strengths, the choice of an optimal structure for further studies in antiviral drug development should be approached on a case-by-case basis, taking into consideration the specific protein in question and the desired level of accuracy and detail required for the investigation.
| Name of software | Name of protein | Z−score mean | RMSD | Z−score standard deviation |
|---|---|---|---|---|
| Swiss model | C Protein | 0.521 | 1.531 | 1.445 |
| L Protein | 0.65 | 1.42 | 1.3 | |
| V Protein | 0.67 | 1.46 | 1.35 | |
| W Protein | 0.4 | 1.34 | 1.28 | |
| AlphaFold | C Protein | 0.75 | 1.34 | 1.2 |
| L Protein | 0.83 | 1.1 | 1.45 | |
| V Protein | 0.78 | 1 | 1.57 | |
| W Protein | 0.82 | 0.89 | 1.79 |
RMSD: Root mean square deviation
Active site prediction
In a recent study, researchers employed structural bioinformatics to unravel the potential binding sites of four fascinating proteins: C, L, V, and W. By leveraging the CASTp, PrankWeb, and SCFBio server for structural comparisons and binding site predictions, alongside template-based modeling and integrating experimental binding data, the scientists shed light on key amino acid residues crucial for substrate interaction [Figures 17-19].
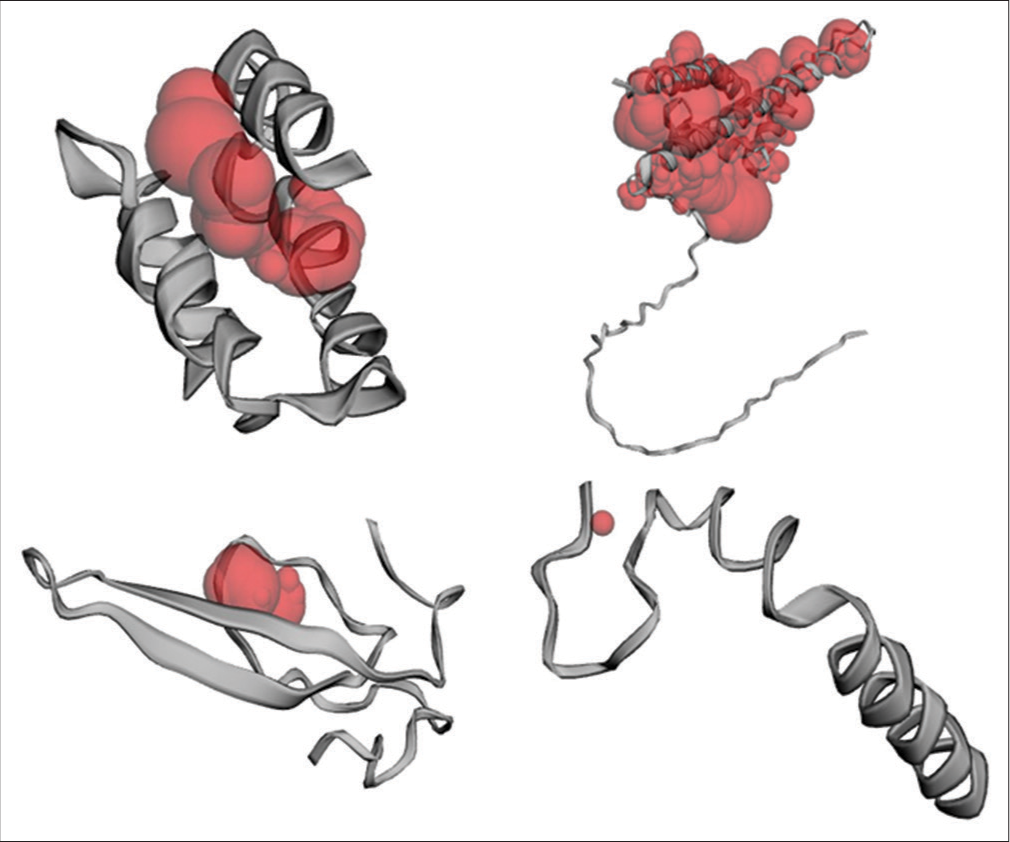
- Active site prediction of the target proteins C, L, V, and W of the Langya virus using CASTp (Computed Atlas of Surface Topography of Proteins).
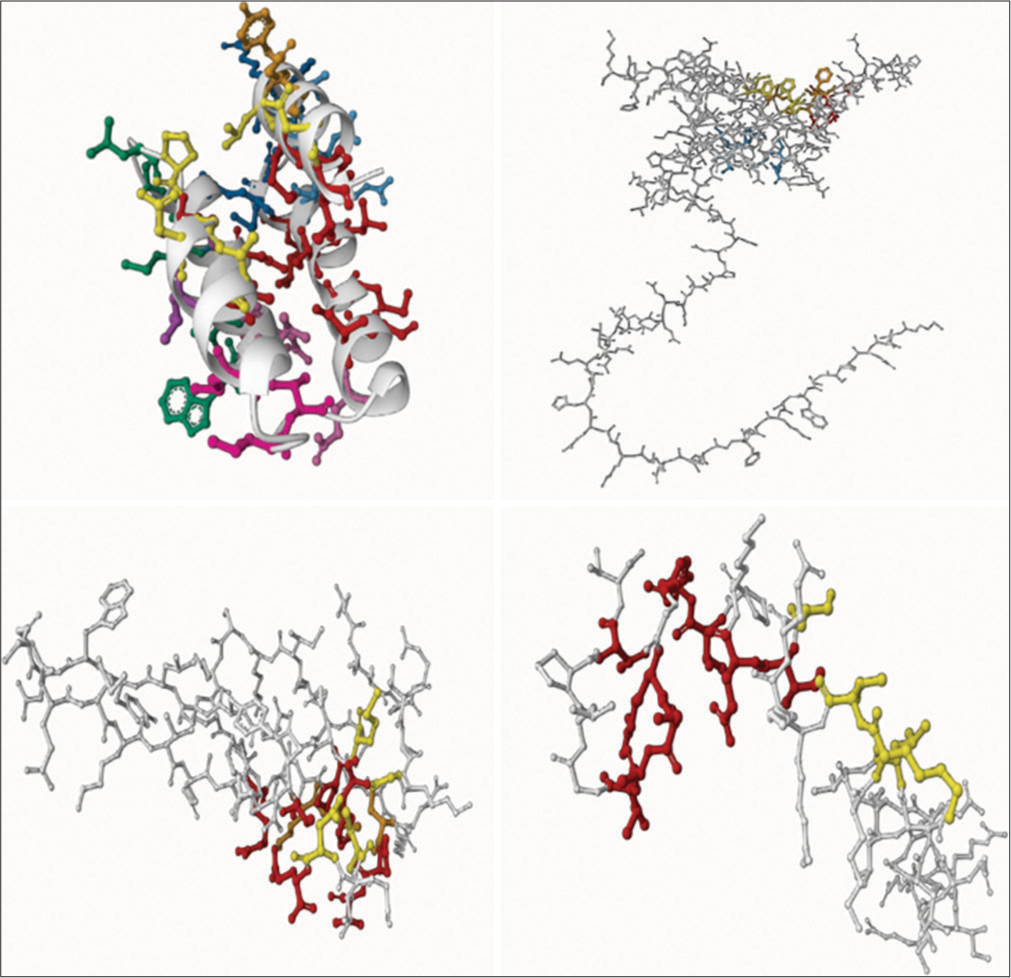
- Predicted ligand binding sites for target proteins C, L, V, and W of Langya virus using PrankWeb.
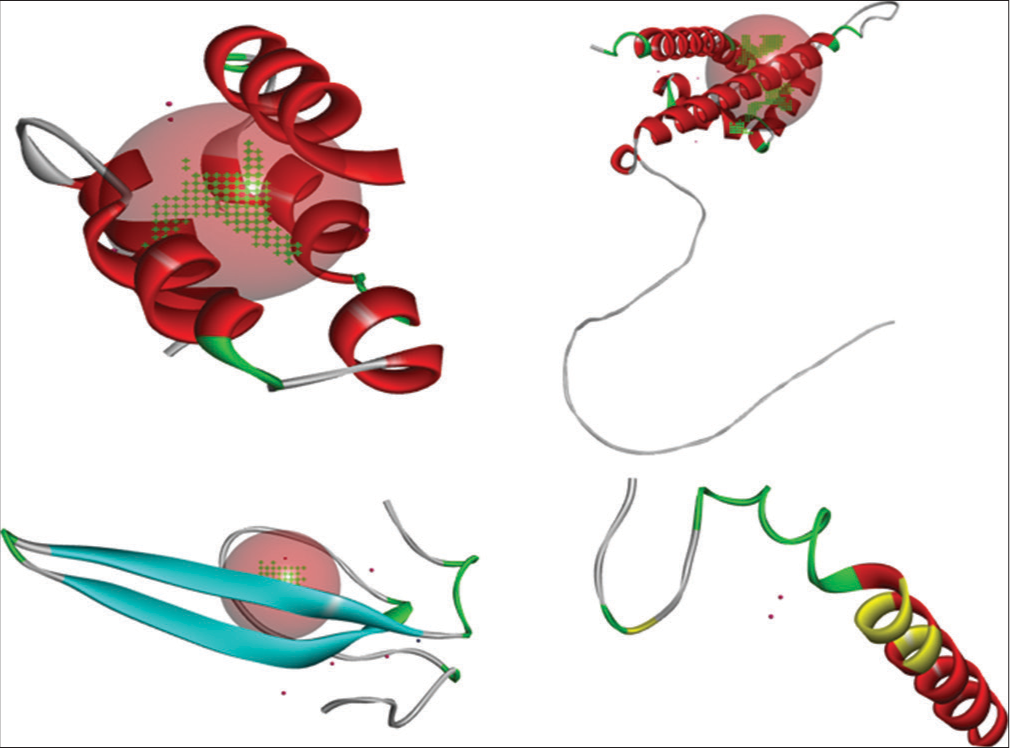
- Active sites for target proteins C, L, V, and W of langay virus obtained from the Supercomputing Facility for Bioinformatics and Computational Biology, with visualization using Discovery Studio.
For Protein C, conserved residues LEU 105, ASN 109, and ILE 125 emerged as favorable docking sites, aligning perfectly with existing data on CD1 and OD1 binding. Similar insights were gleaned for Protein L, where a pocket area of 5920.328 Å2 and residues CA 38, CB 40, and OG 40 emerged as potential binding partners, echoing the interaction profile with HIS and SER. In Protein V, a conserved pocket area and residues NH2, CB, and CD were pinpointed as promising docking sites, corroborating findings on ARG, GLU, and TYR involvement. Finally, for Protein W, the computational analysis unraveled TYR, ARG, and PRO residues as potential docking partners [Figure 17].
This comprehensive understanding of binding interactions in these proteins holds immense significance. It lays the groundwork for rational drug design, paves the way for elucidating functional mechanisms, and opens doors for novel therapeutic strategies. The future lies in experimentally validating these predictions through site-directed mutagenesis and structural biology techniques, while simultaneously exploring the functional implications of these binding interactions in diverse biological contexts. This research not only illuminates the power of structural bioinformatics in identifying potential binding sites but also sparks further experimentation and advances our knowledge of protein function, paving the way for exciting discoveries in the future.
CONCLUSION
This research study focused on the computational exploration of LayV through phylogenetic analysis and molecular modeling. By integrating advanced methodologies such as phylogenetic analysis and molecular modeling, the study aimed to unravel the biological intricacies of LayV and accelerate the development of antiviral therapeutics. The phylogenetic analysis provided insights into the evolutionary trajectory of LayV, revealing its close kinship with other henipaviruses such as the Wenzhou shrew henipavirus 1 and Mojiang virus. The analysis also highlighted the genetic diversity of LayV and its potential implications for future research and public health. Through homology modeling, the study predicted the 3D structures of LayV proteins L, C, V, and W. The models were validated using rigorous evaluation criteria, including structural analysis, energy analysis, and compatibility analysis. The results identified the SwissModel-generated homology models for proteins C, V, and W as superior, with the V Model AF standing out as optimal. Furthermore, the study employed advanced computational tools for active site prediction, allowing for the identification and quantification of active sites within the protein structures. This information is crucial for understanding the functional domains and potential binding interactions of LayV proteins.
Overall, this research provides a comprehensive computational approach to unlocking the antiviral arsenal against LayV. The findings pave the way for targeted antiviral interventions and contribute to the development of diagnostic tools and therapeutic interventions. By elucidating the molecular choreography of LayV and its proteins, this study reinforces the commitment to public health and addresses the complexities of viral infections.
Ethical approval
This study did not require Institutional Review Board (IRB) approval because it utilized publicly available data and did not involve any procedures that posed potential risks to participants.
Declaration of patient consent
Patient’s consent not required as there are no patients in this study.
Conflicts of interest
There are no conflicts of interest.
Use of artificial intelligence (AI)-assisted technology for manuscript preparation
The authors confirm that there was no use of artificial intelligence (AI)-assisted technology for assisting in the writing or editing of the manuscript and no images were manipulated using AI.
Financial support and sponsorship
Nil.
References
- Molecular insights into the flavivirus replication complex. Viruses. 2021;13:956.
- [CrossRef] [PubMed] [Google Scholar]
- Ledipasvir and sofosbuvir for previously treated HCV genotype 1 infection. N Engl J Med. 2014;370:1483-93.
- [CrossRef] [PubMed] [Google Scholar]
- Structure and design of Langya virus glycoprotein antigens, bioRxiv [Preprint] 2023 Update. Proc Natl Acad Sci U S A. 2024;121:e2314990121.
- [CrossRef] [PubMed] [Google Scholar]
- Large-scale generation of functional mRNA-encapsulating exosomes via cellular nanoporation. Nat Biomed Eng. 2020;4:69-83.
- [CrossRef] [PubMed] [Google Scholar]
- Basic local alignment search tool. J Mol Biol. 1990;215:403-10.
- [CrossRef] [PubMed] [Google Scholar]
- SWISS-MODEL: Homology modelling of protein structures and complexes. Nucleic Acids Res. 2018;46:W296-303.
- [CrossRef] [PubMed] [Google Scholar]
- Highly accurate protein structure prediction with AlphaFold. Nature. 2021;596:583-9.
- [CrossRef] [PubMed] [Google Scholar]
- 1988. Bethesda, MD: National Library of Medicine (US), National Center for Biotechnology Information; Available from: https://www.ncbi.nlm.nih.gov [Last accessed on 2017 Apr 06]
- A greedy algorithm for aligning DNA sequences. J Comput Biol. 2000;7:203-14.
- [CrossRef] [PubMed] [Google Scholar]
- MEGA5: Molecular evolutionary genetics analysis using maximum likelihood, evolutionary distance, and maximum parsimony methods. Mol Biol Evol. 2011;28:2731-9.
- [CrossRef] [PubMed] [Google Scholar]
- MEGA6: Molecular evolutionary genetics analysis version 6.0. Mol Biol Evol. 2013;30:2725-9.
- [CrossRef] [PubMed] [Google Scholar]
- A machine learning method for detecting autocorrelation of evolutionary rates in large phylogenies. Mol Biol Evol. 2019;36:811-24.
- [CrossRef] [PubMed] [Google Scholar]
- Efficient methods for dating evolutionary divergences In: The molecular evolutionary clock: Theory and practice. Berlin: Springer; 2020. p. :197-219.
- [CrossRef] [Google Scholar]
- Statistical method for testing the neutral mutation hypothesis by DNA polymorphism. Genetics. 1989;123:585-95.
- [CrossRef] [PubMed] [Google Scholar]
- MEGA X: Molecular evolutionary genetics analysis across computing platforms. Mol Biol Evol. 2018;35:1547-9.
- [CrossRef] [PubMed] [Google Scholar]
- Studies on a rhinovirus (EC11) derived from a calf. II. Disease in calves. J Comp Pathol. 1971;81:41-8.
- [CrossRef] [PubMed] [Google Scholar]
- Phylogenetic analysis based evolutionary study of 16S rRNA in known Pseudomonas sp. Bioinformation. 2015;11:474-80.
- [CrossRef] [PubMed] [Google Scholar]
- ColabFold: Making protein folding accessible to all. Nat Methods. 2022;19:679-82.
- [CrossRef] [PubMed] [Google Scholar]
- Main-chain bond lengths and bond angles in protein structures. J Mol Biol. 1993;231:1049-67.
- [CrossRef] [PubMed] [Google Scholar]
- Homology modeling for human adam12 using prime, i-tasser and easymodeller. Int J Pharm Pharm Sci. 2014;6:782-6.
- [Google Scholar]
- CASTp 3.0 Computed atlas of surface topography of proteins. Nucleic Acids Res. 2018;46:W363-7.
- [CrossRef] [PubMed] [Google Scholar]
- The Phyre2 web portal for protein modeling, prediction and analysis. Nat Protoc. 2015;10:845-58.
- [CrossRef] [PubMed] [Google Scholar]
- PrankWeb: A web server for ligand binding site prediction and visualization. Nucleic Acids Res. 2019;47:W345-9.
- [CrossRef] [PubMed] [Google Scholar]
- Structure and energetics guide dynamic behaviour in a T = 3 icosahedral virus capsid. Biophys Chem. 2024;305:107152.
- [CrossRef] [PubMed] [Google Scholar]
- CASTp: Computed atlas of surface topography of proteins with structural and topographical mapping of functionally annotated residues. Nucleic Acids Res. 2006;34:W116-8.
- [CrossRef] [PubMed] [Google Scholar]


