
Translate this page into:
Employing an “aging paradox” to uncover effective measures for advancing productive longevity


*Corresponding author: Harry G. Preuss, Departments of Biochemistry and Medicine, Georgetown University Medical Center, Washington DC 200057, United States. preusshg@georgetown.edu
-
Received: ,
Accepted: ,
How to cite this article: Preuss HG, Kaats G, Mrvichin N, Bagchi D, Aruoma OI. Employing an “aging paradox” to uncover effective measures for advancing productive longevity. Am J Biopharm Pharm Sci 2022;2:6.
Abstract
Data gathered from healthy and non-diabetic volunteers who previously had participated in assorted clinical research trials, reveal that many medical risk factors primarily related to insulin resistance (IR) and the metabolic syndrome (MS) gradually intensify between ages 25 and 70 years. This phase here labeled “Continuum of risks” (CR) is a period whereby the metabolic changes that correlate with health situations adjust unfavorably but never exceed nor fall outside ranges that would diagnose established pathological diseases. The strengths of some of these risk factors unexpectedly reverted in an opposite and beneficial direction. This occurred somewhere beyond age 70 years. This phenomenon is defined as “Aging paradox” (AP). Because comparing data from the CR and AP periods did not reveal any significant differences in the glucose-insulin relationships with other components of MS, the beneficial happenings in AP were attributed to “Survivor bias.” The meaning behind this is that those volunteers possessing the more promising profile of risk factors can contribute to clinical studies, while participants with poorer profiles cannot take part as volunteers in later life due to medical debilities or even death. Health-wise, the average values of the following markers changed in a favorable direction when evaluated in the later AP period: Body weight, fat mass, fat free mass, levels of fasting blood glucose (FBG), triglycerides, HDL-cholesterol, and alanine aminotransferase enzyme. The lowering of FBG levels signifies the lessening of IR, the well accepted driving force behind MS. In contrast, total, LDL-, and non-HDL-cholesterol levels as well as systolic blood pressure essentially did not transform favorably over time. Health parameters associated with active survival should be at the center of attention in any developing schema to extend meaningful longevity. Thus, natural regimens involving nutrition, exercise, and dietary supplement usage exist to carry out necessary therapeutic measures to mitigate IR and its disabling components – thus potentially contributing to a longer healthier lifespan.
Keywords
Continuum of risks
Metabolic syndrome
Continuum of risks
Aging paradox
Metabolic syndrome
Aging paradox
Biological aging
cardiovascular diseases
Age-dependent renal function
Metabolic factors
Insulin resistance
Biological aging
Lifespan augmentation

INTRODUCTION
It is widely recognized that noteworthy extensions of useful lifespan are taking place in many modern societies.[1] While some valuable background information has recently been forthcoming regarding reasons behind such happenings, added observations and opinions should undoubtedly allow even greater potential toward experiencing a longer and healthier existence for far more individuals.[2-7] In undergoing enhanced scrutiny though, two objectives should be examined more closely and acted on with realistic enthusiasm: First, the safest and most reliable existing programs need to be identified and utilized while new improved ones are being discovered; and second, those programs that achieve the most benefits need to be highlighted more effectively for public consumption.
With the above goals in mind, a significant role for the glucose-insulin system in the aging process will, by and large, be the central focus here. One fact has already been established. It is generally accepted that Type 2 diabetes mellitus (T2DM), a severe form of insulin resistance (IR), may bring about premature aging.[3,4,8-13] Yet, it is uncertain that possessing relatively milder forms of IR in non-diabetics may in due course also add significantly to the eventual hastening of biological aging.[8-10] The presence of IR as well as other elements associated with the metabolic syndrome (MS) such as the extent of fat mass (FM) may well play a key roles in the rate of biological aging even when existing in what most would consider insignificant states (strength levels) of metabolic stress that usually are ignored.[14-16]
It stands to reason that validation through credible methodology would be necessary for most individuals to institute long-term anti-aging measures over a lifespan. Still, how to accomplish a novel, convincing justification becomes a most important challenge. An extraordinary paradox came to the forefront in investigations dealing with non-alcoholic fatty liver disease (NAFLD), an entity very closely linked to MS.[16-19] In examining material from cross-sectional clinical studies, data from many of the afflicted individuals in the oldest category age-wise showed less harmful signs of their liver disorder compared to younger groupings.[20,21] The preceding discovery made in the most elderly of subjects was largely based on their relatively lessened circulating alanine aminotransferase (ALT) levels when compared to younger counterparts: ALT measurements are considered a reasonable marker of NAFLD status.[22] However, the irony did not stop with this single observation of the liver perturbation.
Along similar lines, when examining “elderly data” from the previous cross-sectional clinical studies, we also had noted that other risk factors besides heightened ALT levels, including some harmful components related to MS, seemed to improve over the lifespan of the study volunteers (somewhere beyond age 70 years).[23,24] The fasting blood glucose (FBG) level that can serve as a surrogate for IR revealed a steady, typical increase with aging from the teens to the 70s.[14-16] However, somewhere after that, it began showing an overall reduction in the most elderly compared to younger volunteers in our cross-sectional analyses.[23,24] This scenario is labeled “Aging paradox,” a conundrum where a variety of harmful risk factors that commonly contribute adversely to the biological aging process surprisingly appear to “metabolically mend,” that is, improve health-wise toward the end of the life cycle.[16,23,24] The primary focus of the present investigation is to more closely examine the linkage of IR represented by circulating FBG and accompanying risk factors during the aging paradox (AP) period. Of utmost importance, what this information might logically imply concerning measures to enhance meaningful lifespan in the future would be invaluable. Optimal natural lifestyle approaches particularly in nutrition alongside good exercise practices can play a key roles in shaping the long-term status of IR and thus place individuals in favorable positions to achieve that longer and healthier lifespan.[25]
MATERIAL AND METHODS
Clinical material
Integrative Health Technologies, Inc., a Clinical Research Organization in San Antonio, Texas, has amassed a 40-year Longitudinal Database of Medical Biomarkers derived from dual energy X-ray total body scans dual energy X-ray absorptiometry (DEXAs) and fasting 45-blood chemistry panels. Although not a true representative of a national sample, the data were obtained from study participants living in all 50 states in the US. All study participants executed a written statement granting permission to use their redacted data in the future clinical trials and research publications. For the most part, the volunteers were relatively healthy, run-of-the-mill individuals. Therefore, the most measurements in this single-center and observational cohort study are expected to fall in generally accepted “normal” ranges. Thus, linear correlations become a key means to assess trends in developments related to health matters, that is, slope-based rather than threshold analyses are employed for the most part here.[23,24]
To begin with, baseline data in the present report were accumulated from both male and female subjects (age 16– 91 years). The material was collected from tests conducted from February 2014 to July 2019. Data were limited to purportedly “normal subjects” who had volunteered after they were provided an informed consent form and were asked to review the form with their health-care provider to ensure that they had no medical conditions that would preclude their participation. It is especially important to note that material was used only from the subjects possessing a circulating FBG level in the non-diabetic range (125 mg/dl or less). In addition, individual data employed for analyses were limited to values that fell within three standard deviations of the group mean. Despite all, this resulted in very little elimination of material. After removing information from volunteers with FBG levels greater than 125 mg/dl, data from 718 subjects were still left to evaluate. “Resting” blood pressures and heart rates were obtained after study participants had remained prone for ~15 min while completing their DEXA testing. All study participants executed an informed consent form in compliance with the Helsinki Declaration and were allowed to participate by independent Institutional Solutions Review Board (IRB), (http://ohrp.cit.nih.gov/search/IrbDtl.aspx). To reemphasize, material was obtained only from volunteers who granted written permission to use the redacted data in the future analyses. Quest Diagnostics conducted all blood testing after study participants had fasted for at least 10 h.
Time intervals considered
Based on the previous experiences and prior first approximations, we chose to arbitrarily divide data derived from the human life cycle into 3-time periods to examine two of them separately. The 1st time consists of the developmental stage where individuals are growing from childhood and maturing into adulthood.[26] This time interval devoted largely to growth and development was designated to last through age 24 years. Information describing this maturation period is not included in the present investigation.
The 2nd time begins with the initiation of a well-recognized and characteristic decline in the renal glomerular filtration rate, because we believe this mechanism to be related in some manner to the general aging phenomenon.[26] Accordingly, this life cycle aging period in our data interpretation begins at 25 years of age and lasts until 70 years. During this longest period of the life cycle, many risk factors pertaining to MS and the aging process are progressing. The functioning of a variety of risk factors such as blood pressure, a multitude of dyslipidemias, and glucose-insulin perturbations is taking place and providing a continuum of metabolic risks linked to the aging process despite not usually reaching levels consistent with any disease diagnoses, especially diabetes mellitus. As a first approximation, observations will be made in this time interval that we have labeled in the past “Continuum of risks” for comparative purposes.[26] The 3rd time sequence (AP) was set as a first approximation to begin after 71 years and ends here at 91 years of age. It contains unexpected paradoxes that often defy reason when compared to the preceding period.[23,24,26]
Statistical analysis
Multivariate regression analyses were analyzed using KaleidaGraph graphing and datum analysis, Version 4.1.3 Synergy Software, Reading, PA. P < 0.05 (two-tail) determined using a table of correlation coefficients (Pearson r values) was statistically significant, whereas P > 0.05 < 0.10 was designated as a trend. Statistics between two columns were carried out using Student’s t-test.
RESULTS
The continuum of risks and the AP periods were assessed separately. The data listed in [Table 1] emanate from the continuum of risks time frame. To gain a rough approximation of changes over that period, average values were assessed at ages 25–70 years. Between these years, FBG levels increased statistically significantly (P≤0.001) – roughly 6 mg/dl from an average of 87 mg/dl at age 25 years to an average of 93 mg/ dl at age 70 years. Similarly, FM also increased significantly (P ≤ 0.007) from an average of 53 pounds to an average of 65 pounds over the same temporal period. At the same time, fat free mass (FFM) decreased significantly (P < 0.001) by –14 pounds. Both systolic and diastolic blood pressures increased by 5- and 4-mm Hg, respectively (P ≤ 0.001), as the levels of ALT and aspartate aminotransferase enzymes also rose (P ≤ 0.001). All the circulating fat markers including total cholesterol, LDL-cholesterol, non-HDL-cholesterol, HDL-cholesterol, and triglycerides increased significantly over the 45-year continuum of risks period. Finally, the high sensitivity C-reactive protein (hsCRP) trended upward, while white blood cell count (WBC) did not change significantly.
| Parameter | n | R value | Stat Sig | Ave (at 25 and 70 years) |
|---|---|---|---|---|
| FBG (mg/dl) | 519 | +0.172 | P≤0.001 | 87-93 |
| Body Weight (lbs) | 499 | –0.053 | P=0.237 | 175–170 |
| Fat mass (lbs) | 503 | +0.108 | P≤0.015 | 53–65 |
| Fat free mass (lbs) | 494 | –0.172 | P≤0.001 | 110–96 |
| Systolic BP (mm Hg) | 491 | +0.254 | P≤0.001 | 118–123 |
| Diastolic BP (mm Hg) | 477 | +0.165 | P≤0.001 | 70–74 |
| Heart Rate (beats/min) | 471 | +0.016 | P=0.733 | 67–68 |
| Alanine aminotransferase (IU/L) | 567 | +0.082 | P≤0.001 | 17–20 |
| Aspartate aminotransferase (IU/L) | 562 | +0.142 | P≤0.001 | 18–20 |
| Total cholesterol (mg/dl) | 499 | +0.196 | P≤0.001 | 181–210 |
| LDL-cholesterol (mg/dl) | 503 | +0.192 | P≤0.001 | 105–122 |
| Non-HDL-cholesterol (mg/dl) | 496 | +0.176 | P≤0.001 | 129–145 |
| HDL-cholesterol (mg/dl) | 493 | +0.114 | P≤0.011 | 55–62 |
| Triglycerides (mg/dl) | 579 | +0.113 | P=0.006 | 98–120 |
| High sensitivity C-reactive protein (mg/L) | 476 | +0.077 | P 0.093 | 2.0–2.9 |
| WBC (103/mcl) | 566 | +0.008 | P=0.840 | 6.0–6.0 |
n=number of observations, the + and – signs before the r values indicate positive or negative slope, Stat Sig indicates statistical value of linear correlation: Ave indicates the approximate mean value of results at the beginning age (25 years) and ending age (70 years) of continuum of risks to give some general idea of overall changes for non-diabetics over this temporal period. Age=Independent variable
In the AP period depicted in [Table 2], from ages 71–91 years, some of the linear correlations compared to the continuum of risks period now reversed course by changing in a statistically significant manner. The beneficial changes in direction from positive to negative for the various linear correlations have been highlighted in red to indicate the presence of an “Aging paradox.” This was readily apparent for FBG, FM, ALT, and triglycerides. The slope data for HDL-cholesterol (positive), body weight (negative), and FFM (negative) are also highlighted in red, although a change in slope direction did not take place. For what reason was this done? This course was taken, because a much more, easily observable positive or negative slope did occur in the paradox period compared the continuum period, which we considered distinct enough to be labeled a “change.”
| Parameter | n | R value | Stat Sig | Ave (at 71 and 91 years) |
|---|---|---|---|---|
| FBG (mg/dl) | 374 | R=–0.134 | P≤0.009 | 95–88 |
| Body Weight (lbs) | 137 | R=–0.374 | P≤0.001 | 180–115 |
| Fat Mass (lbs) | 126 | R=–0.269 | P≤0.003 | 72–40 |
| Fat Free Mass (lbs) | 126 | R=–0.281 | P≤0.002 | 110–75 |
| Systolic BP (mm Hg) | 53 | R=+0.178 | P=0.201 | 126–138 |
| Diastolic BP (mm Hg) | 71 | R=–0.042 | P=0.169 | 76–72 |
| Heart Rate (beats/min) | 71 | R=+0.142 | P=0.239 | 65–74 |
| ALT (IU/L) | 360 | R=–0.116 | P=0.027 | 20–16 |
| AST (IU/L) | 374 | R=+0.048 | P=0.355 | 22–24 |
| Total chol (mg/dl) | 362 | R=–0.078 | P=0.139 | 202–198 |
| LDL-chol (mg/dl) | 315 | R=–0.065 | P=0.250 | 125–117 |
| Non-HDL chol (mg/dl) | 361 | R=–0.079 | P=0.134 | 145–150 |
| HDL-chol (mg/dl) | 360 | R=+0.023 | P=0.665 | 59–60 |
| Triglycerides (mg/dl) | 306 | R=–0141 | P=0.013 | 125–80 |
| hsCRP (mg/L) | 209 | R=–0.157 | P=0.023 | 206–1.0 |
| WBC (103/mcl) | 91 | R=–0.027 | P=0.799 | 5.8–5.6 |
n=number of observations, the + and – signs before the r values indicate positive or negative slopes, Stat Sig indicates statistical value of linear correlation: Ave indicates the approximate mean value of results at the beginning (age 71 years) and ending (age 91 years) of period for Aging Paradox to give some general idea of overall changes in period for these non-diabetics. Numbers in red indicate marked change in slope between two periods – the Aging Paradox period and Continuum of Risks period
The findings for FBG and perhaps FM are of particular importance, since these factors in the minds of most experts are the predominant driving forces behind the accompanying components of MS.[27] Hence, we further assessed the AP in our volunteers using figures [Figure 1a and b] to focus more on these two important parameters. To emphasize once more, FBG is an important surrogate for IR and FM accumulation, for obesity. What happens to these two vital components over most of the continuum of risks period is depicted in [Figure 1a]. Both show a similar upward positive trend. Differently, [Figure 1b] featuring the AP period reveals a decidedly downward negative trend for both elements. Notably, [Figure 1a and b] accentuate the obvious change in direction between the two temporal periods under examination for both important major components of MS. In [Figure 1c], the overall regressions after showing both the slope values derived from the continuum of risks (FM 1) and AP (FM 2) periods regarding FBG versus FM is similar despite the different direction in aging revealed between the two distinct time periods [Figure 1a and b] – there were no differences between young and old volunteers in strength of the relationships between this metabolic correlation. While the changes noted in perusing the two tables dealing with the continuum of risks period [Table 1] and the AP period [Table 2] are quite valuable; perhaps, the most interesting aspect of the data is the significant changes that did not take place. This is especially true when referring to the results concerning systolic BP and some circulating lipids. [Figures 2-5] display both the correlations for the continuum and paradox periods in the same figure.

- (a) The course of FBG (black dots and red line) and FM (red dots and blue line) over the continuum of risks period (ages 25–70 years) is depicted – a steady statistically significant positive ascent in both cases. (b) The course of FBG (black dots and red line) and FM (red dots and blue line) over the aging paradox period (ages 71–91 years) – a steady statistically significant negative descent in both cases. (c) FBG versus fat mass in continuum (black dots and red line) (FM1) and aging paradox (red dots and blue line) (FM2) periods – virtually same linear correlation.

- Comparing the course of SBP over the continuum of risks period (black dots and red line) (ages 25–70 years) and the aging paradox period (red dots and blue line) (ages 71–91 years). See text for further descriptive details.

- Comparing the course of LDL-cholesterol over the continuum of risks period (black dots and red line) (ages 25– 70 years) is positive. In the aging paradox period (red dots and blue line) (ages 71–91 years), the slope has no statistical significance. A similar portrayal would appear had total and non-HDL cholesterol been chosen for illustration.
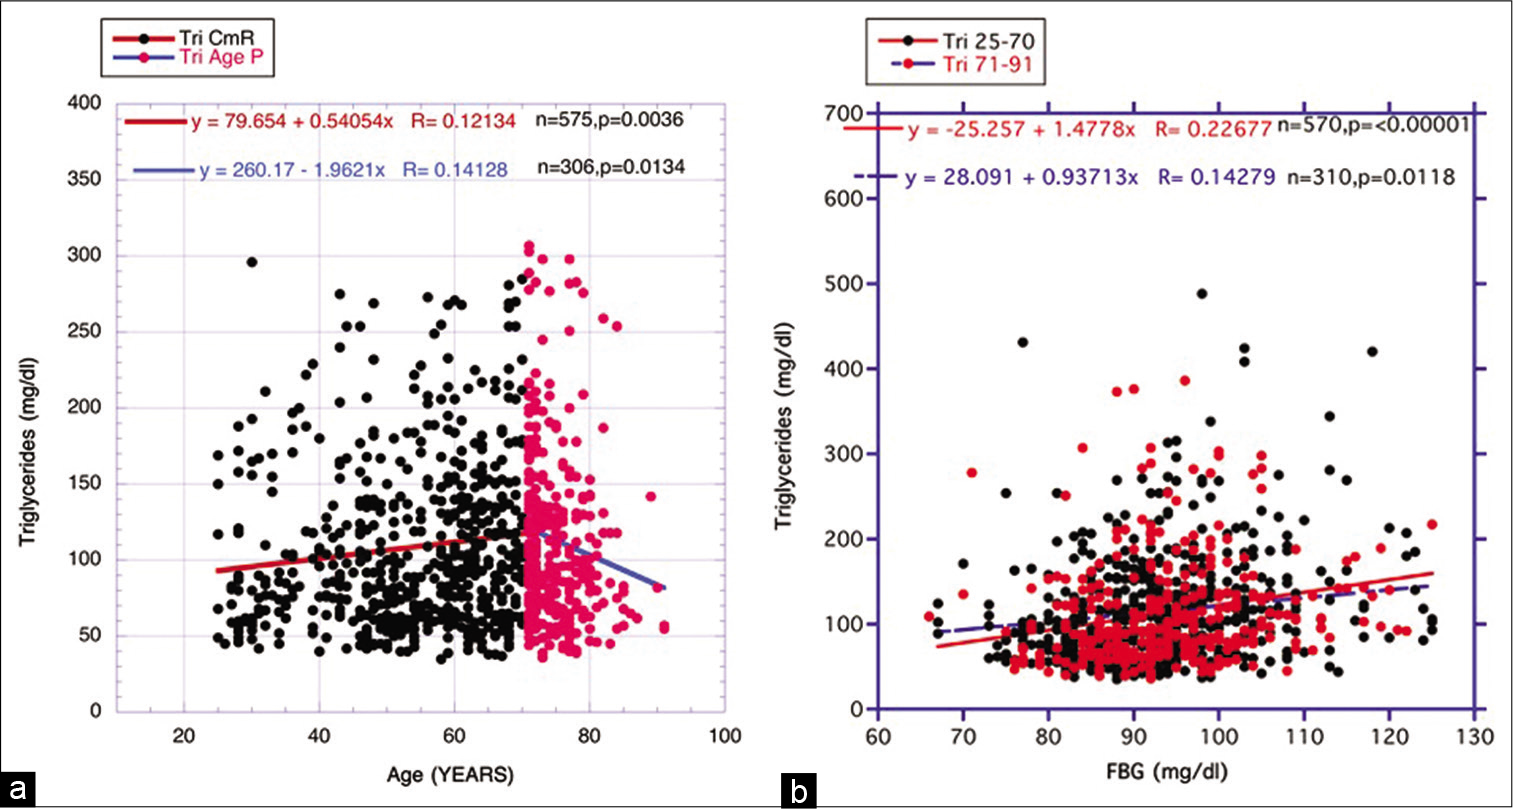
- (a) Comparing the course of triglycerides over the continuum of risks period (black dots and red line) (ages 25–70 years) and the aging paradox period (red dots and blue line) (ages 71–91 years). The difference is direction between the two periods that are quite apparent. (b) Circulating FBG versus triglyceride in continuum (black dots and red line) (Tri 25–70) and aging (red dots and blue line) (Tri 71-91), temporal periods. There is virtually the same linear correlation for the young and elderly volunteers suggesting that the metabolic relationship between the two components of MS remains essentially unchanged.
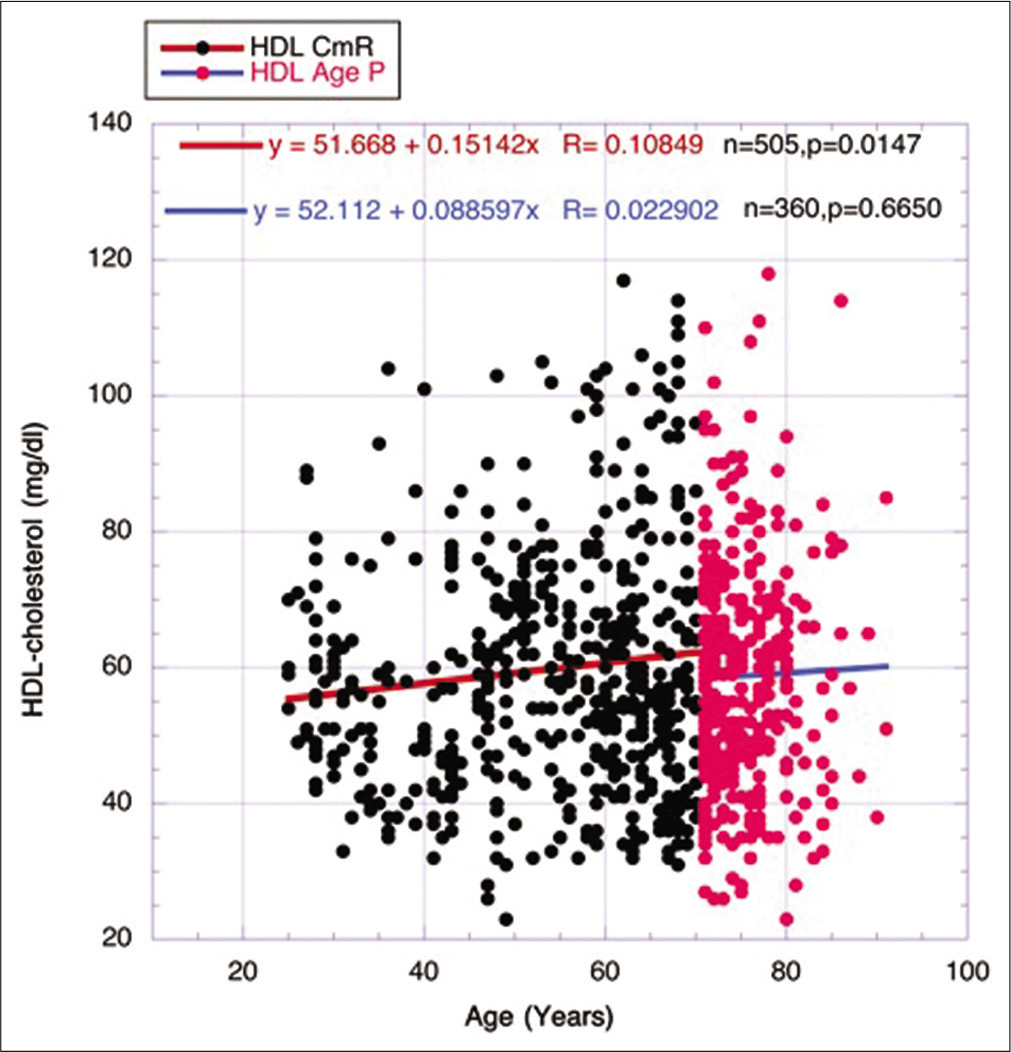
- Comparing the course of HDL-cholesterol over the continuum of risks period (black dots and red line) (ages 25–70 years) and the aging paradox period (red dots and blue line) (ages 71–91 years).
Unlike the data for FBG and FM presented in [Figure 1a and b], the course of the linear regressions during the AP period regarding systolic BP (SBP) essentially does not change or even may have increased from the continuum period [Figure 2]. Significant reversions in the two periods also did not take place for total cholesterol, non-HDL- cholesterol, and LDL-cholesterol [Table 2]. The findings for LDL-cholesterol are displayed in [Figure 3] and represent what is apparent for the other two lipid designations (total and non-HDL). Differently, lipid exceptions, that is, obvious changes between periods, did take place in triglycerides and perhaps HDL-cholesterol findings, which will be displayed separately in [Figures 4 and 5].
In [Figure 4a], the reversed downward course of the triglycerides during the paradox period is quite apparent and certainly differs from what happens with the other circulating lipids, that is, total, LDL-, and non-HDL-cholesterol. In [Figure 4b], comparing the linear regression lines in the separate two periods for FBG versus triglyceride levels, correlative similarities are revealed as previously revealed in [Figure 1c]. Therefore, differing strengths of metabolic links appear not to account for the divergences as shown in [Figure 4a] between the two periods.
In [Figure 5], the slow swing of HDL-cholesterol, that is, the slope of the line of regression, is relatively similar in the AP compared to the continuum of risks period. Thus, the changes in [Figures 4 and 5] (triglyceride down and HDL-cholesterol somewhat stable but upward represent maintenance of favorable health in many of the most elderly subjects.[23,24]
DISCUSSION
Confusion over aging definition
The term chronological aging presents little difficulty in understanding: It is what it is. The same cannot be said for biological aging. The present ways to define this entity appear unsatisfactory to many and certainly should not appease the most exacting of scientists.[2-5] Nevertheless, something is needed here as a point of departure. Aging develops from sequential or progressive physiological changes in an organism that leads to senescence, that is, increased risk of debility through poor adaptation to metabolic stress, greater potential to develop all sorts of diseases, and often death.[4,5] This can be linked to a reduction in reparative and regenerative potential in tissues and organs as well. Often the definition is accompanied by a cautionary warning: It is important to distinguish between the purely physicochemical processes of aging and the incidences of disease and injury that can interrupt mortality. Concerning the last statement, ironically, age represents the primary risk factor for chronic diseases -- including, cardiovascular, malignant, and neurodegenerative conditions.[4]
Popular background associations with biological aging
At any rate, perhaps, the greatest deterrent to a concrete definition of the entity is that no single theory to explain all the phenomena linked to biological aging has ever been recognized. Some potential involvements are listed below and dealt with in an overly simplified fashion to favor brevity yet maintain some modicum of background knowledge that includes genetics, cross-linking reactions in vivo, autoimmune reactions, oxidative stress- induced damage, glycation reactions, and endocrine abnormalities. These are intrinsically involved at varying degrees in the so-called aging process.[2-5]
Role of the glucose-insulin system in aging
In the context of the endocrine theory, emphasis will be placed on the glucose-insulin system and its nutritional implications with the realization that it is only one aging factor among a group of others, but a very important one that influences lifespan.[3,8-13] IR is a principal driving force behind T2DM, a metabolic disorder that has been linked to premature aging time and again; and second, IR is ameliorated to a very significant degree by caloric restriction, a practice, perhaps, the leading one that has long been recognized to extend longevity.[7,28-34]
IR and some accompanying risk factors intensify during the early portion of life cycle (continuum of risks)
In most of the relatively healthy and non-diabetics examined here during the period between ages 25 and 70 years, both circulating FBG and FM levels show steady statistically significant increases that still fall generally into ranges considered by many “typical, innocuous readings” – chemistry values that do not connote a diagnosis of T2DM [Table 1, Figure 1a]. However, we hypothesize that while seemingly slight on the face of it, the correlation upward for IR (FBG) and its unfavorable accompaniments, such as increasing blood concentrations of ALT [Table 1] and triglycerides [Table 1, Figure 4a], can portend detrimental outcomes over time. Comparable depictions have been shown in the previous communications denoting continuum of risks happenings.[23,24,26]
The AP period heralds the potential to recognize whether and what common risk factors may prolong lifespan
That improvement in values of some parameters dealing with health unexpectedly takes place in the “older elderly” is now being recognized in a variety of published communications.[20,21,24] In the first two tables and some of the ensuing figures shown [Figures 1a, b, 4a], comparing the correlative slopes from the AP periods with those from the continuum of risks periods often demonstrate marked changes between them – usually occurring sometime after age 70 years. These sources from older volunteers show that the upward age-related trends for FBG, FM, ALT, and triglycerides found in the younger stage are reversed demonstrating improvement health-wise in these risk factors later [Table 3]. The further reduction in body weight and FFM during AP may imply the presence also of some form of caloric restriction in the total scenario dealing with the AP.
| Favorable Changes in Health |
| Fasting Blood Glucose |
| Fat Mass |
| Body Weight |
| Fat Free Mass |
| ALT |
| HDL-cholesterol |
| Triglycerides |
| Unfavorable or No Helpful Changes in Health |
| Systolic Blood Pressure |
| Diastolic Blood Pressure |
| Heart Rate |
| Aspartate aminotransferase |
| Total Cholesterol |
| LDL-cholesterol |
| Non-HDL-cholesterol |
| White Blood Cell Count |
| Uncertain Changes in Health |
| C-reactive Protein (hsCRP) |
Examining circulating lipid levels during aging provides some intriguing observations. LDL-cholesterol, like total cholesterol and non-HDL-cholesterol, shows essentially no real change between the continuum and paradox periods, that is, really slight and insignificant improvement when considering survivor bias [Figure 3]. In contrast, triglycerides display a marked decrease [Figure 4a] in the latter period suggesting an overall improvement in fitness in both cases. Many sources in the past have questioned the utility of treating total, LDL-, and non-HDL-cholesterol, especially in the elderly.[35-39] Our data support that conclusion when using the AP to arrive at that decision point. The lack of change in systolic blood pressure [Figure 2] has been noted earlier for both IR and caloric restriction and is not unexpected, although difficult to explain in some respects at present.[11,29,40,41]
Aging Paradox Relates to Survivor Bias
The late temporal changes found in the AP period for FBG, FM, ALT, and triglycerides may require further investigation to fully decipher. Still, it would be hard to believe that all these onerous health risks that amplify over the early life cycle could mend with aging. In addition, the fact that the linear correlative relationships occurring in the two designated life cycle periods (the continuum of risks and AP) between FBG as the independent variable and both fat mass [Figure 1c] and triglycerides [Figure 4b] as the dependent variables essentially do not deviate in any way fortifies, to some degree, the overall assumption that substantial metabolic changes are not taking place between the CR and AP periods.
Hence, we favor the “survivor bias” mechanism among the human volunteers as a primary explanation for the findings depicted in the tables and figures. This theory is exemplified elegantly in a previous laboratory study working with caloric restriction and the glucose-insulin system in rats.[33] Two separate groups of rats were maintained – a caloric restricted group alongside an ad libitum food consuming one. Throughout this temporal study, the circulating FBG levels in the ad libitum fed rats were decidedly greater at all the timed measurements – basically indicating that the free-eating group possessed a higher level of IR. Even so, the combined FBG data from both groups were averaged over the lifecycle to give a reading falling halfway between each group. Eventually, the less healthy, ad libitum-eating rats died earlier on than the caloric restricted ones, no doubt because of the nutritional status. This removed their higher FBG levels from the averaging procedure near the study termination and thus lowered the final mean FBG level of the survivors. An AP is evident – derived to a great extent through a lower average FBG attained exclusively from the longer living, healthier, and caloric restricted rat population toward the end of their life cycle.[23,33] Clearly, a significant metabolic changes within a given living organism near the end of the lifespan are not the explanation behind the AP described here.[23,33]
Indeed, Rosedale et al. point out that human centenarians have lower blood glucose, insulin, and serum triglycerides than those who do not live to be over 100 years old.[11] Similarly, the present investigation reveals that most elderly volunteers available to contribute data are the ones possessing the most ideal glucose-insulin metabolism over their earlier life cycle. Changes in FBG and other contributors to the AP [Table 3] as well as the ratio triglyceride/HDL-cholesterol (another surrogate for IR) support the postulate that improvement in IR was responsible for at least some of the favorable survivorship among the research subjects in the previous clinical studies.[42-45]
Often, the average human in the past has demonstrated limited interest in undertaking and maintaining promising health strategies that commit to extensive use of time – certainly when it comes to a lifespan. To change direction, we believe that at least two prerequisites are vital to overcome this unfortunate circumstance. First, the presence of straight-forward and favorable evidence indicating a strong likelihood of success from the involved strategies must be clear; and second, any therapeutic approaches should be obviously safe and, for the most part, easy to follow.[11,34] A good example supporting the last statement would be the attempts to introduce caloric restrictive measures as continuing lifestyle practices.[31,32,34] Even though the weight of evidence shows marked success at lengthening lifespan in animal models through this practice, convincing successful examples dealing with human experiences are not readily available. In the face of this, it becomes hard to institute and maintain a program of general fasting, especially when constantly confronted by the ubiquitous presence of flavor-enticing modern Western dietary choices. Dietary choices in other parts of the world would need to be factored in by researchers in this field to fully establish the cause and effects associated with the AP.
CONCLUSION
Regarding that first pre-requisites mentioned above, we have offered what we believe is solid clinical evidence that keeping IR in check has the potential to bring on longer, productive lifespans.[24] This has been accomplished somewhat by examining “survivor bias” in the AP period of the lifecycle. In truth, the idea that maintaining optimal insulin sensitivity can augment lifespan has been around for a while.[8-11,24] Still, this first requirement for reasonable proof has been made stronger in the data presented here.
Maintaining ideal lifestyle responses for prolonged periods can be so grueling as well as intensely boring to some that even most believers cannot keep up the proper level of enthusiasm. Fortunately, simple examples provide some hope that ideal personalized regimens can be developed to overcome the aging perturbations emanating from glucose-insulin imbalance.
A case in point that successful long-term, health management is possible lies in the use of daily multivitamin over the lifespan. The “multivitamin routine” is in common use by countless ordinary people. Hence, why not the everyday intake of safe and effective dietary supplements, especially for those that cannot undergo the strains involve in maintaining optimal lifestyle choices?1 Like the daily multivitamin intake or even alongside it, employing safe and natural supplements that augment insulin sensitivity, such as trivalent chromium, might make an important difference on longevity.[46-52] Although some vitamin formulas already contain such dietary supplements as chromium, we are referring to adequate amounts per day – like 200 mcg. Other natural supplements are also available to attack glucose-insulin perturbations. For example, some merit in this respect has been shown for cinnamon, Vitamin D3, and maitake mushroom.[53] Finally, newer measures that aid in ameliorating IR, like supplements that block dietary carbohydrate absorption in the gastrointestinal tract and/or medications that increase renal excretion of glucose through SGLT2 inhibitors, should be considered for the future potential therapeutic usage.[54-59]
Declaration of patient consent
Institutional Review Board (IRB) permission obtained for the study.
Financial support and sponsorship
Nil.
Conflicts of interest
Dr. Okezie I Aruoma is the Editor-in-Chief and Dr. Debasis Bagchi is the Associate Editor of the journal.
Footnote
References
- Aging throughout history: The evolution of human lifespan. J Mol Evol. 2020;88:57-65.
- [CrossRef] [PubMed] [Google Scholar]
- Molecular and physiological manifestations and measurement of aging in humans. Aging Cell. 2017;16:624-33.
- [CrossRef] [PubMed] [Google Scholar]
- Aging Encyclopaedia Britannica Publisher: Encyclopaedia Britannica, Inc. 2020. Available from: https://www.britannica.com/science/aging-life-process [Last accessed on 2022 Apr 19]
- [Google Scholar]
- Lifespan extension via dietary restriction: Time to reconsider the evolutionary mechanisms? Bioessays. 2020;42:e1900241.
- [CrossRef] [PubMed] [Google Scholar]
- Nutrition and longevity from mechanisms to uncertainties. Crit Rev Food Sci Nutr. 2020;60:3063-82.
- [CrossRef] [PubMed] [Google Scholar]
- The insulin system in health and disease. J Am Coll Nutr (Ed). 1997;16:393-4.
- [CrossRef] [PubMed] [Google Scholar]
- Effects of glucose/insulin perturbations on aging and chronic disorders of aging: The evidence. J Am Coll Nutr. 1997;16:397-403.
- [CrossRef] [PubMed] [Google Scholar]
- Insulin resistance: A factor of aging. In: Ghen MJ, Corso N, Joiner-Bey H, Klatz R, Dratz A, eds. The Advanced Guide to Longevity Medicine. Landrum, SC: Ghen; 2001. p. :239-50.
- [Google Scholar]
- On behalf of the Leiden longevity study group: Familial longevity is marked by enhanced insulin sensitivity. Aging Cell. 2011;10:114-21.
- [CrossRef] [PubMed] [Google Scholar]
- on behalf of the Leiden Longevity Study Group: High serum glucose levels are associated with a higher perceived age. Age (Dordr). 2013;35:189-95.
- [CrossRef] [PubMed] [Google Scholar]
- Fasting circulating glucose levels in the non-diabetic range correlate appropriately with many components of the metabolic syndrome. Orig Internist. 2016;23:78-89.
- [Google Scholar]
- Longitudinal examination of links between risk factors for the metabolic syndrome and both age and fasting glucose levels in non-diabetic subjects. J Am Coll Nutr. 2018;37:302-7.
- [CrossRef] [Google Scholar]
- Examining the relationship between nonalcoholic fatty liver disease and the metabolic syndrome in nondiabetic subjects. J Am Coll Nutr. 2018;13:1-9.
- [CrossRef] [PubMed] [Google Scholar]
- NAFLD as a risk factor for the development of diabetes and the metabolic syndrome: An eleven-year follow-up study. Am J Gastroenterol. 2009;104:861-7.
- [CrossRef] [PubMed] [Google Scholar]
- Nonalcoholic fatty liver disease: A precursor of the metabolic syndrome. Dig Liver Dis. 2015;47:181-90.
- [CrossRef] [PubMed] [Google Scholar]
- Non-alcoholic fatty liver disease in older people. Gerontology. 2009;55:607-13.
- [CrossRef] [PubMed] [Google Scholar]
- Serum levels of alanine aminotransferase decrease with age in longitudinal analysis. Clin Gastroenterol Hepatol. 2012;10:285-90.
- [CrossRef] [PubMed] [Google Scholar]
- Alanine aminotransferase as a marker of non-alcoholic fatty liver disease in relation to Type 2 diabetes mellitus and cardiovascular disease. Diabetes Metab Res Rev. 2006;22:437-43.
- [CrossRef] [PubMed] [Google Scholar]
- Circulating ALT levels in healthy volunteers over lifespan: Assessing the aging paradox and nutritional implications. J Am Coll Nutr. 2019;38:661-9.
- [CrossRef] [PubMed] [Google Scholar]
- Reflecting on concepts relevant to contemplating the relationship between glucose/insulin perturbations and aging. J Am Coll Nutr. 2019;38:463-9.
- [CrossRef] [PubMed] [Google Scholar]
- The Bitter Sweet: Recognizing and Resolving the Sugar Crisis In: North Charleston. South Carolina: Marcelle Publishing; 2017. p. :30-52.
- [Google Scholar]
- Probing the relationship between declining renal glomerular filtration over the lifespan and accompanying insulin resistance: Does the former provide means to estimate the rate of aging. J Am Coll Nutr 2021:1-12.
- [CrossRef] [PubMed] [Google Scholar]
- Interplay between insulin resistance and body fat mass in evolution of perturbations linked to the metabolic syndrome in non-diabetics: Emphasis on inflammatory factors. J Am Coll Nutr. 2021;40:43-52.
- [CrossRef] [PubMed] [Google Scholar]
- Life span study of SPF Fischer 344 male rats fed ad libitum or restricted diets: Longevity, growth, lean body mass, and disease. J Gerontol. 1982;37:130-41.
- [CrossRef] [PubMed] [Google Scholar]
- Nutritional influences on aging of Fischer 344 rats: Physical, metabolic, and longevity characteristics. J Gerontol. 1985;40:657-70.
- [CrossRef] [PubMed] [Google Scholar]
- Effect of age of initiation of feed restriction on growth, body composition, and longevity of rats. J Gerontol. 1986;41:13-9.
- [CrossRef] [PubMed] [Google Scholar]
- Dietary restriction and aging: Historical phases, mechanisms, current directions. J Nutr. 1987;117:1650-4.
- [CrossRef] [PubMed] [Google Scholar]
- The Retardation of Aging and Disease by Dietary Restriction Springfield IL: McGraw-Hill; 1988.
- [Google Scholar]
- Dietary restriction alters characteristics of glucose fuel use. J Gerontol. 1992;47:B202-8.
- [CrossRef] [PubMed] [Google Scholar]
- Aging in focus: Caloric restriction may put the brakes on aging. J NIH Res. 1995;7:47-50.
- [Google Scholar]
- Inverse association of serum cholesterol with plasma insulin in the elderly: Cross sectional and prospective analyses. Aging (Milano). 1998;10:137-40.
- [CrossRef] [PubMed] [Google Scholar]
- Is it advantageous to lower cholesterol in the elderly hypertensive? Cardiovasc Drug Ther. 2000;14:397-405.
- [CrossRef] [PubMed] [Google Scholar]
- Lack of an association or an inverse association between low-density-lipoprotein cholesterol and mortality in the elderly: A systematic review. BMJ Open. 2016;6:e010401.
- [CrossRef] [PubMed] [Google Scholar]
- Serum total cholesterol and risk of cardiovascular and non-cardiovascular mortality in old age: A population-based study. Geriatrics. 2017;17:294.
- [CrossRef] [PubMed] [Google Scholar]
- Associations between serum levels of cholesterol and survival to Age 90 in postmenopausal women. J Am Geriatr Soc. 2020;68:288-96.
- [CrossRef] [PubMed] [Google Scholar]
- General lack of correlations between age and signs of the metabolic syndrome in subjects with non-diabetic fasting glucose values. J Am Coll Nutr. 2017;36:556-64.
- [CrossRef] [PubMed] [Google Scholar]
- Analyzing blood pressure ascent during aging in non-diabetics: Focusing on links to insulin resistance and body fat mass. J Am Coll Nutr. 2021;40:317-26.
- [CrossRef] [PubMed] [Google Scholar]
- The individual components of the metabolic syndrome: Is there a raison d'etre? J Am Coll Nutr. 2007;6:191-5.
- [CrossRef] [PubMed] [Google Scholar]
- Use of metabolic markers to identify overweight individuals who are insulin resistant. Ann Intern Med. 2003;139:802-9.
- [CrossRef] [PubMed] [Google Scholar]
- Is there a simple way to identify insulin resistant individuals at increased risk for cardiovascular disease? Am J Cardiol. 2005;96:399-404.
- [CrossRef] [PubMed] [Google Scholar]
- Assessing the triglyceride/HDL-cholesterol ratio as a surrogate for insulin resistance in Hispanics and African-Americans In: Preuss HG, Bagchi D, eds. Dietary Sugar, Salt and Fats. London, UK: Academic Press; 2020. p. :325-46.
- [CrossRef] [Google Scholar]
- Nutritional factors influencing the glucose/ insulin system: Chromium. J Am Coll Nutr. 1997;16:404-10.
- [CrossRef] [PubMed] [Google Scholar]
- Niacin-bound chromium (NBC) increases life span in Zucker rats. J Inorg Chem. 2011;105:1344-9.
- [CrossRef] [PubMed] [Google Scholar]
- Effect of treatment with phenformin, diphenylhydantoin or L-dopa on life span and tumour incidence in C3H/Sn mice. Gerotology. 1980;26:214-46.
- [CrossRef] [PubMed] [Google Scholar]
- Insulin and longevity: Antidiabetic biguanides as geroprotectors. Biogerontology. 2003;4:297-307.
- [CrossRef] [Google Scholar]
- Metformin improves health span and lifespan in mice. Nat Commun. 2013;4:2192.
- [CrossRef] [PubMed] [Google Scholar]
- Metformin: A hopeful promise in aging research. Cold Spring Harb Perspect Med. 2016;6:a025932.
- [CrossRef] [PubMed] [Google Scholar]
- Metformin improves healthspan and lifespan in mice. Nat Commun. 2013;4:2192.
- [CrossRef] [PubMed] [Google Scholar]
- Potential of diet and dietary supplementation to ameliorate the chronic clinical perturbations of the metabolic syndrome In: Sinatra S, Houston M, eds. Nutritional and Integrative Strategies in Cardiovascular Medicine. Boca Raton, Florida: CRC Press; 2015. p. :148-78.
- [CrossRef] [Google Scholar]
- Partially purified white bean amylase inhibitor reduces starch digestion in vitro and inactivates intraduodenal amylase in humans. Gastroenterology. 1985;88:1895-902.
- [CrossRef] [Google Scholar]
- Phaseolus vulgaris and alpha amylase inhibition. In: Bagchi D, Preuss HG, eds. Obesity: Epidemiology, Pathophysiology, and Prevention. Boca Raton, FL: CRC Press; 2007. p. :423-32.
- [CrossRef] [Google Scholar]
- Bean amylase inhibitor and other carbohydrate absorption blockers: Effects on diabesity and general health. J Am Coll Nutr. 2009;28:266-76.
- [CrossRef] [PubMed] [Google Scholar]
- It's no has been: A review of the effects of white kidney bean extract on body composition and metabolic health. Nutrients. 2020;12:1398.
- [CrossRef] [PubMed] [Google Scholar]
- Efficacy and safety of sodium glucose co-transport 2 inhibitors in Type 2 diabetes: A meta-analysis of randomized controlled trials. Diabetes Res Clin Pract. 2014;103:269-75.
- [CrossRef] [PubMed] [Google Scholar]
- Diabetic ketoacidosis and related events in the canagliflozin Type 2 diabetes clinical program. Diabetes Care. 2015;38:1680-6.
- [CrossRef] [PubMed] [Google Scholar]


